Andy West, PhD Profile picture
Dec 20 9 tweets 5 min read
PREPARE FOR HIGHER VOLATILITY:

Important 🧵:

We’ve had a bear mkt rally which has now failed and partially unwound. Brief Santa rally or not, the following chart pack tells a clear story of impending volatility:

#macro #stocks $SPY $QQQ
Financial conditions:

This chart isn’t a mirror image - it’s the GS Fin Cond index against the #SPX. I’ve been tweeting updates on this for 6 mths because when conditions tighten, #stocks roll. Once again the Fed and now BoJ have triggered the tightening needed for inflation 🧯
Yields:

10 year yields are on the rise again with added fuel from the BoJ pivot yesterday. As the benchmark the risk free rate, this is negative for #SPX in the near term
Yield curve & volatility:

Perversely, with long rates rising but the short end not, the yld curve is flattening atm. People may think that’s good given inversions signal recession, so flattening must be the opposite?

For #stocks, a flattening has preceded a VIX spike this yr:
FX Volatility:

Markets are linked. Part of HedgQurters risk mgt philosophy is to monitor for vol spikes in macro sensitive mkts as signal for equity vol which often lags. FX rebounding post BoJ surprise:
Bond Vol:

Similarly, early signs that bond volatility will rebound as it’s been asleep for the last couple months but bounces off the current level regularly. If so will bleed into stocks:
Credit Spreads:

Corporate Spreads have cooled over the last couple months but the high yield and BBB spreads are at levels where theyve found a floor and may be showing early signs of rebounding which would be expected with higher bond market volatility
Putting it all together:

Hawkish msgs from #Fed, the #ECB and now BoJ are stoking volatility in macro sensitive mkts. Yields are rising again, credit spreads are likely to follow and all this tightens financial conditions which the first chart in 🧵 showed are critical…
for the performance of $SPY, $QQQ and #stocks generally

A flattening yld curve driven by a rise in the 10 year yield has shown to precede equity volatility spikes

Time to hedge up.

hedgquarters.Com

• • •

Missing some Tweet in this thread? You can try to force a refresh
 

Keep Current with Andy West, PhD

Andy West, PhD Profile picture

Stay in touch and get notified when new unrolls are available from this author!

Read all threads

This Thread may be Removed Anytime!

PDF

Twitter may remove this content at anytime! Save it as PDF for later use!

Try unrolling a thread yourself!

how to unroll video
  1. Follow @ThreadReaderApp to mention us!

  2. From a Twitter thread mention us with a keyword "unroll"
@threadreaderapp unroll

Practice here first or read more on our help page!

More from @andycwest

Dec 14
#Fed day: the down/up reaction of #stocks shows something here for both hawks & doves.

For me (looking ahead), the Fed faces a dilemma in 1H '23. Cool/negative goods/energy inflation but still strong wage gains given tight labor.

Headline CPI...
#macro
will fall (particularly in Q1), potentially to even ~5% by March data, but wage gains will see medium term services & core inflation drivers inconsistent in the Fed's lens with a sustainable return to 2-3% target.

So Mr Mkt is saying based on history, the Fed never keeps...
rates at peak for long (ie the market assumes rate cuts soon after the peak).

But we need to consider that perhaps this time, with the labor pool down due to COVID and structural labor tightness, the #Fed may be FORCED to keep rates at the peak plateau for longer...
Read 10 tweets
Nov 14
Updated Inflation, rates outlook & prospects for #bonds and #stocks:

We're moving into a new phase of disinflation from here. This is what I expect to see unfold: Update 🧵:

#macro $SPY $QQQ #inflation
Back in early August I wrote that we were about to experience a surge in core inflation into end Q3.

At the time #stocks had rallied strongly and this presaged another pullback given it meant the #Fed had to be more hawkish.

I was a touch early w/ mths:
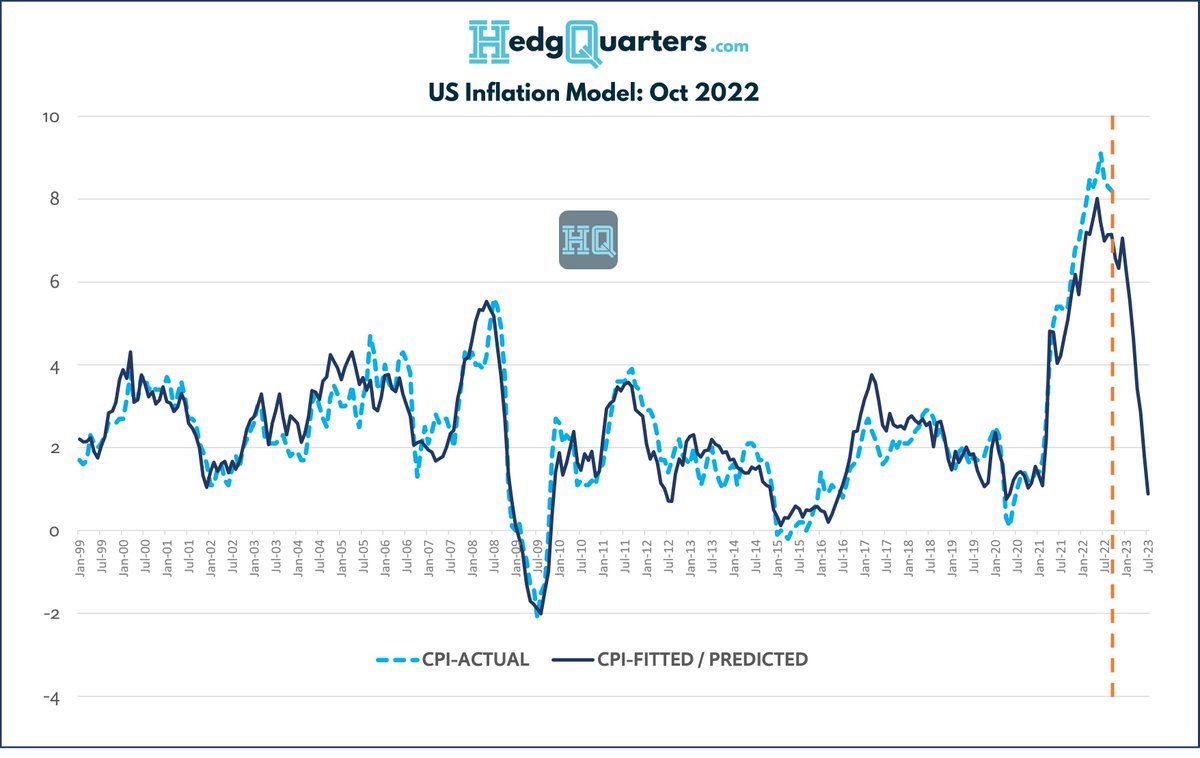
This played out and I've posted my multi-factor inflation model for US CPI previously. It shows #inflation moderating quickly in mid 2023:

Fair to say this generates skepticism. The narrative is once CPI >5% it stays there for > 2 years. Well where to now? Image
Read 13 tweets
Oct 26
$GOOGL: I honestly don't even know where to start in breaking down this disaster of a quarter from $GOOG (and no, I'm NOT short, except by way of sector ETF).

Read the usual bulge bracket broker reports and you'd think this is ok. Its NOT and here's why

a 🧵:
$QQQ $SPY
First - is this rev growth a pass or fail? Simply - BIG fail. Here's the internet advertising price growth chart from HedgQuarter's Info Tech Sector Drivers dashboard

Ad prices are still up 10-20% YoY so the 10% rev growth for search ads & 3.8% for YouTube is abysmal.
2nd - are costs being managed? If you were the owner of a business whose mgt grew its headcount by 20% while in the last 2 Qtrs your net revs grew 12% & 7%, I think you'd have a few choice words.

$GOOG mgt bought their own B/S and chowed down. They thought it would last 4ever
Read 6 tweets
Oct 19
PART 2 of 2 - Bond crash implications for stocks:

Why does the #bonds crash signal further pressure for #stocks?
(& why do rate hikes take so long to show in earnings?)

Here I deal with general corporates, consumer & the banks:
$SPY $QQQ #macro
CORPORATES:

As cost of capital rises, the direct impact on corporate earnings starts small then builds. The direct impact of higher rates on corporate borrowings can be estimated to be only approx -2-3% on EPS extra each year due to termed out debt at past low rates. But
about 20% of debt gets refi’d each yr so this builds to a more material headwind over 12-24 mths.

WORKING CAPITAL EFFECTS

Working capital terms start to get tightened by companies as rates rise. Due to WC debt costs (mainly floating rates), companies are forced to offer
Read 21 tweets
Oct 19
Why does the #bonds crash signal further pressure for #stocks?
(& why do rate hikes take so long to show in earnings?)

High inflation & rate hikes transmit through the economy with a range of 1st to 3rd order effects with varying lags. Lets map those out:

PART 1 of 2 threads:
This is complicated to map given various dynamics, sectors & lags, particularly with 280 char limits! But lets give it a go anyway. This is descriptive to help you think through aspects & trades you may not have yet considered

Theres 2 PARTS to this thread due to length
Direct impacts:

When rates are hiked in response to #CPI, theres 2 1st order effects that are fairly contemporaneous. First #bond prices fall as they are the direct inverse of their rate. Higher Fed Funds, higher rates across the curve, lower bond prices
h/t @leadlagreport chart
Read 18 tweets
Oct 17
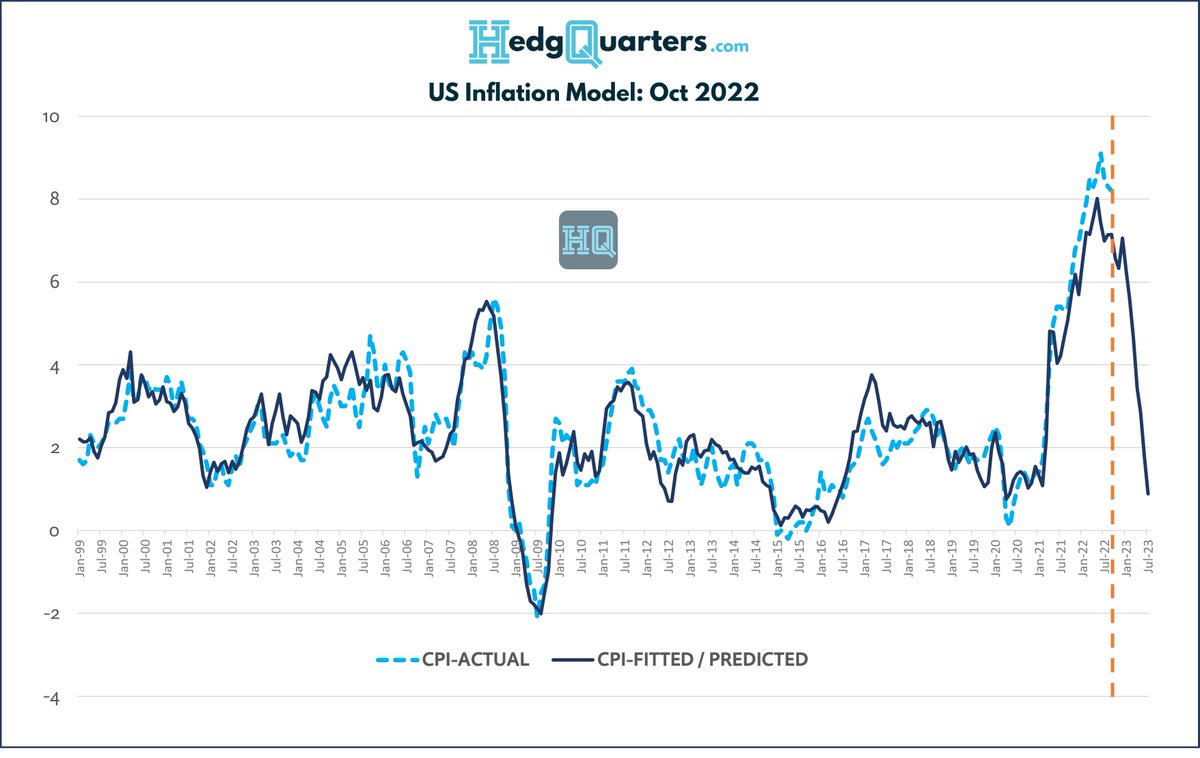
What the updated US Inflation Model shows will happen from here:

The Fed's primary input into rate decisions continues to be CPI & as we know CPI is a lagging indicator. So what does data show will happen to CPI from here & the implications for rates?

#macro $SPY $QQQ #SPX #CPI
We've updated out HedgQuarters.com US #Inflation model with recent data and the forecasts are critical for the rates outlook and timing.

Chart shows Actual CPI (light blue) vs model (dark blue). Image
As can be seen, the peak is clearly past but #CPI will likely stay high to year end. The model suggests in the vicinity of 7.5% still by end December.

What happens in 2023? Image
Read 15 tweets

Did Thread Reader help you today?

Support us! We are indie developers!


This site is made by just two indie developers on a laptop doing marketing, support and development! Read more about the story.

Become a Premium Member ($3/month or $30/year) and get exclusive features!

Become Premium

Don't want to be a Premium member but still want to support us?

Make a small donation by buying us coffee ($5) or help with server cost ($10)

Donate via Paypal

Or Donate anonymously using crypto!

Ethereum

0xfe58350B80634f60Fa6Dc149a72b4DFbc17D341E copy

Bitcoin

3ATGMxNzCUFzxpMCHL5sWSt4DVtS8UqXpi copy

Thank you for your support!

Follow Us on Twitter!

:(