🐻♉️↗️↘️↔️⚠️🚩🔺🔻🧮 💰
Macro Review 🧵
02/05/2023
1/9
The #macro market has been hyper focused on growth and inflation dynamics
We got a slew of data showing inflation under control.
Yet one data point on Friday raised havoc with my portfolio.
Let’s dig into the 🧮!
Macro Review 🧵
02/05/2023
1/9
The #macro market has been hyper focused on growth and inflation dynamics
We got a slew of data showing inflation under control.
Yet one data point on Friday raised havoc with my portfolio.
Let’s dig into the 🧮!
2a/9
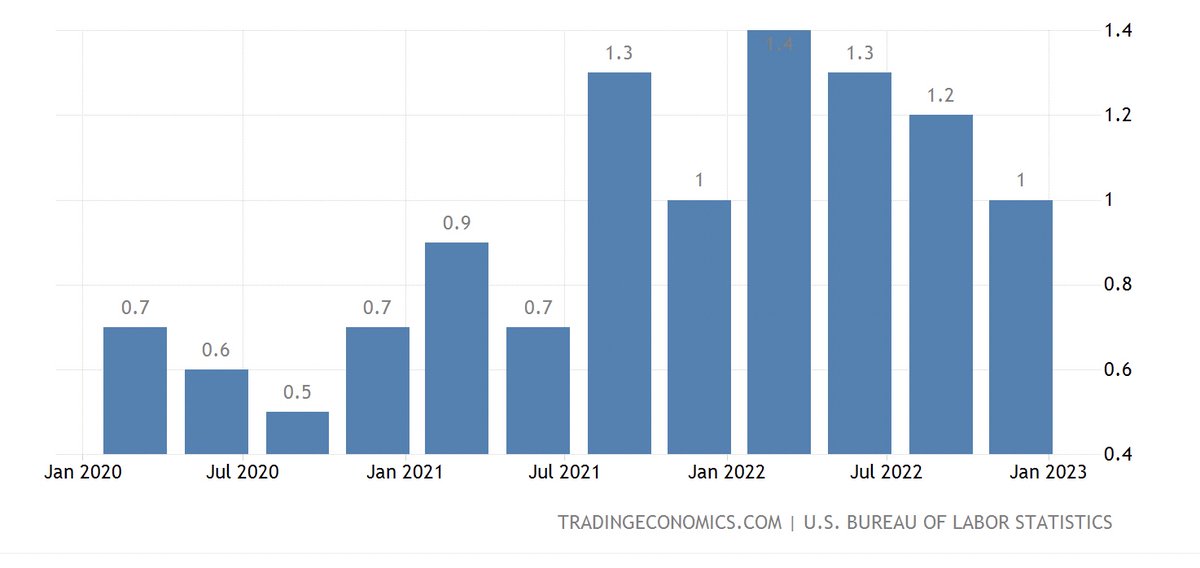
The Employment Cost Index #ECI came out on Tuesday, just prior to the #FOMC meeting
#ECI +1% Q/Q represented a deceleration in employment costs
#Inflation 🔻
The Employment Cost Index #ECI came out on Tuesday, just prior to the #FOMC meeting
#ECI +1% Q/Q represented a deceleration in employment costs
#Inflation 🔻

2b/9
Home prices were also out on Tuesday.
At +8.2% y/y, housing costs continue to decline on an ROC basis
#Inflation 🔻
Home prices were also out on Tuesday.
At +8.2% y/y, housing costs continue to decline on an ROC basis
#Inflation 🔻

2c/9
ISM Manufacturing PMI was out on Fed Day.
At 47.4, the index showed a decal in manufacturing activity even as prices paid 🔺 44.5 from 39.5
#Inflation 🔺
ISM Manufacturing PMI was out on Fed Day.
At 47.4, the index showed a decal in manufacturing activity even as prices paid 🔺 44.5 from 39.5
#Inflation 🔺

2d/9
#JOLTs - a questionable metric - showed an increase in open positions to 11 million
The #FOMC increased the cost of money by 25 bps #Hawish25
#Inflation 🔺and the USD closed at 101.03, a fresh cycle low
#JOLTs - a questionable metric - showed an increase in open positions to 11 million
The #FOMC increased the cost of money by 25 bps #Hawish25
#Inflation 🔺and the USD closed at 101.03, a fresh cycle low

2e/9
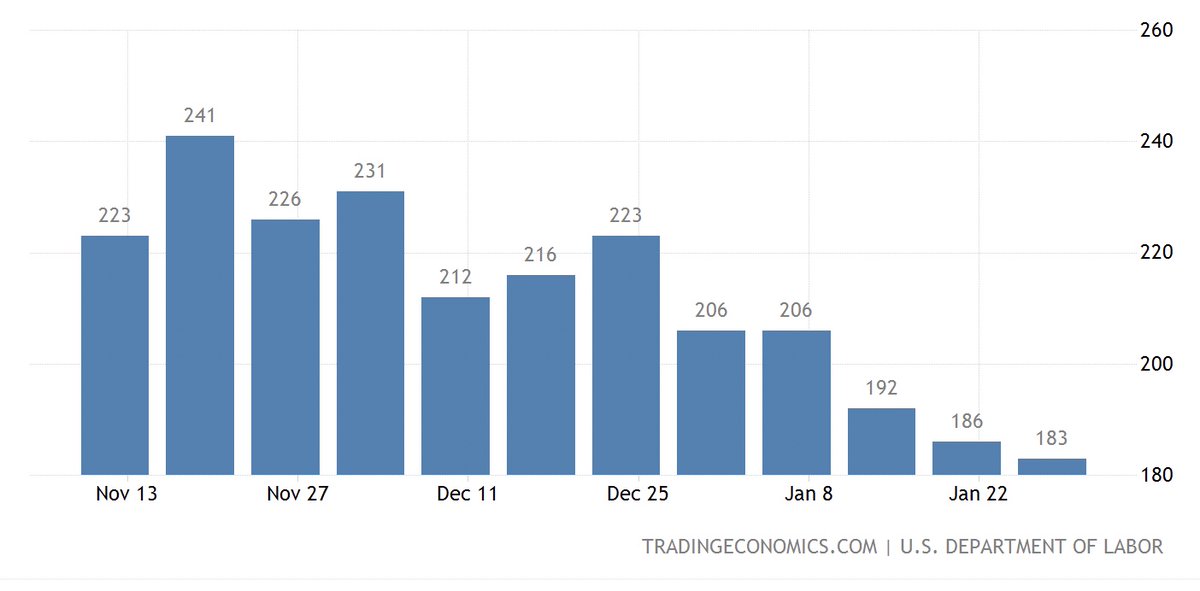
On Thursday both the #BOE and #ECB increased rate by 50 bps, perceived as a #Dovish50.
Stateside, initial jobless claims continued to slide to 183,000.
Growth 💪
On Thursday both the #BOE and #ECB increased rate by 50 bps, perceived as a #Dovish50.
Stateside, initial jobless claims continued to slide to 183,000.
Growth 💪

2f/9
Nonfarm business sector labor productivity +3.0 percent in the fourth quarter of 2022 was also out on Thursday.
The USD put in a new low, but finished higher on the day. #Inflation 🔺
Nonfarm business sector labor productivity +3.0 percent in the fourth quarter of 2022 was also out on Thursday.
The USD put in a new low, but finished higher on the day. #Inflation 🔺

2g/9
#NFP showed a surprising surge in new jobs +517K
BUT unit labor cost +1.0% in Q4, +4.5% y/y (down from +5.2%)
Average Hourly Earnings +4.4% y/y, down from +4.8 and continuing to decel
#Inflation 🔻
#NFP showed a surprising surge in new jobs +517K
BUT unit labor cost +1.0% in Q4, +4.5% y/y (down from +5.2%)
Average Hourly Earnings +4.4% y/y, down from +4.8 and continuing to decel
#Inflation 🔻

2g/9
Then at 10:00AM, ISM Services PMI showed an acceleration to 55.2 from 49.2
All hell broke loose, and they unleashed the Kraken
$USD surged immediately on the news and upended my portfolio.

Then at 10:00AM, ISM Services PMI showed an acceleration to 55.2 from 49.2
All hell broke loose, and they unleashed the Kraken
$USD surged immediately on the news and upended my portfolio.
https://twitter.com/tdarling1/status/1621899688252243968?s=20&t=PRrtLfF0JOt11ae-PMcRmQ

3a/9
The $USD surged +1.02% on the week to close above the 50% retracement level of 102.12 but fell short of a buy signal n the weekly.
The $USD remains 🐻 Trend (T) = 3 months, but has my full attention.
The $USD surged +1.02% on the week to close above the 50% retracement level of 102.12 but fell short of a buy signal n the weekly.
The $USD remains 🐻 Trend (T) = 3 months, but has my full attention.

3b/9
In #FX, the $GBP -2.74% and the $AUD -2.67% took the brunt of the USD abuse
Chart: $GBP with a sell signal on the weekly
In #FX, the $GBP -2.74% and the $AUD -2.67% took the brunt of the USD abuse
Chart: $GBP with a sell signal on the weekly

4a/9
Metals also taken to the woodshed with $SILVER -5.12%, $COPPER -3.89% and $GOLD -2.74%
Chart: $COPPER with a weekly sell signal
Metals also taken to the woodshed with $SILVER -5.12%, $COPPER -3.89% and $GOLD -2.74%
Chart: $COPPER with a weekly sell signal

4b/9
Chart: $GOLD with a weekly sell signal.
I hedged my $GLD position with April 165 puts.
Vol cheap at 15.
Chart: $GOLD with a weekly sell signal.
I hedged my $GLD position with April 165 puts.
Vol cheap at 15.

5a/9
If this PMI number signaled a new uptick in #inflation, then why did hydrocarbons get spanked?
$WTIC -7.89% (w) -20.75% (T)
$GASO -10.42% (w) - 15.02% (T)
Chart: $GASO ⛽️ ↘️ to key support at 2.32
If this PMI number signaled a new uptick in #inflation, then why did hydrocarbons get spanked?
$WTIC -7.89% (w) -20.75% (T)
$GASO -10.42% (w) - 15.02% (T)
Chart: $GASO ⛽️ ↘️ to key support at 2.32

5b/9
$NATGAS -15.42% (w) -45.1% YTD
Chart: Natty is -75% since the August high.
Certainly this is NOT inflationary
$NATGAS -15.42% (w) -45.1% YTD
Chart: Natty is -75% since the August high.
Certainly this is NOT inflationary

6/9
Grains fared much better with $SUGAR +2.19%, SOYB +1.49%, WHEAT +0.9%, and $CORN -0.81%
Chart: $DBA +0.96% on last week’s by signal buy still neutral trend
Grains fared much better with $SUGAR +2.19%, SOYB +1.49%, WHEAT +0.9%, and $CORN -0.81%
Chart: $DBA +0.96% on last week’s by signal buy still neutral trend

7a/9
Yields were little changed on the week with the 2Y +11 bps and the 10Y +1 bps bringing the 10/2s to near cycle lows of -77 bps
Don’t get me started on 10Y3M which finished the week -117 bps with the MOVE 98.99 🔻
Chart: 10/2s
Yields were little changed on the week with the 2Y +11 bps and the 10Y +1 bps bringing the 10/2s to near cycle lows of -77 bps
Don’t get me started on 10Y3M which finished the week -117 bps with the MOVE 98.99 🔻
Chart: 10/2s

7b/9
Bond ETFs were little changed on the week with the notable exception of $TIP -0.85% and $IVOL -2.93%
Chart: $IVOL - Interest Rate Volatility EFT tied to TIP - punished
Bond ETFs were little changed on the week with the notable exception of $TIP -0.85% and $IVOL -2.93%
Chart: $IVOL - Interest Rate Volatility EFT tied to TIP - punished

8a/9
🇺🇸 equity indices continued to party with $IWM +3.91%, $COMPQ +3.31%, and $SPX +1.62%
Chart: The most watched chart on the planet, $SPX daily broke both the downtrend line and the 50% retracement level, but could not hold the fib
🇺🇸 equity indices continued to party with $IWM +3.91%, $COMPQ +3.31%, and $SPX +1.62%
Chart: The most watched chart on the planet, $SPX daily broke both the downtrend line and the 50% retracement level, but could not hold the fib

8b/9
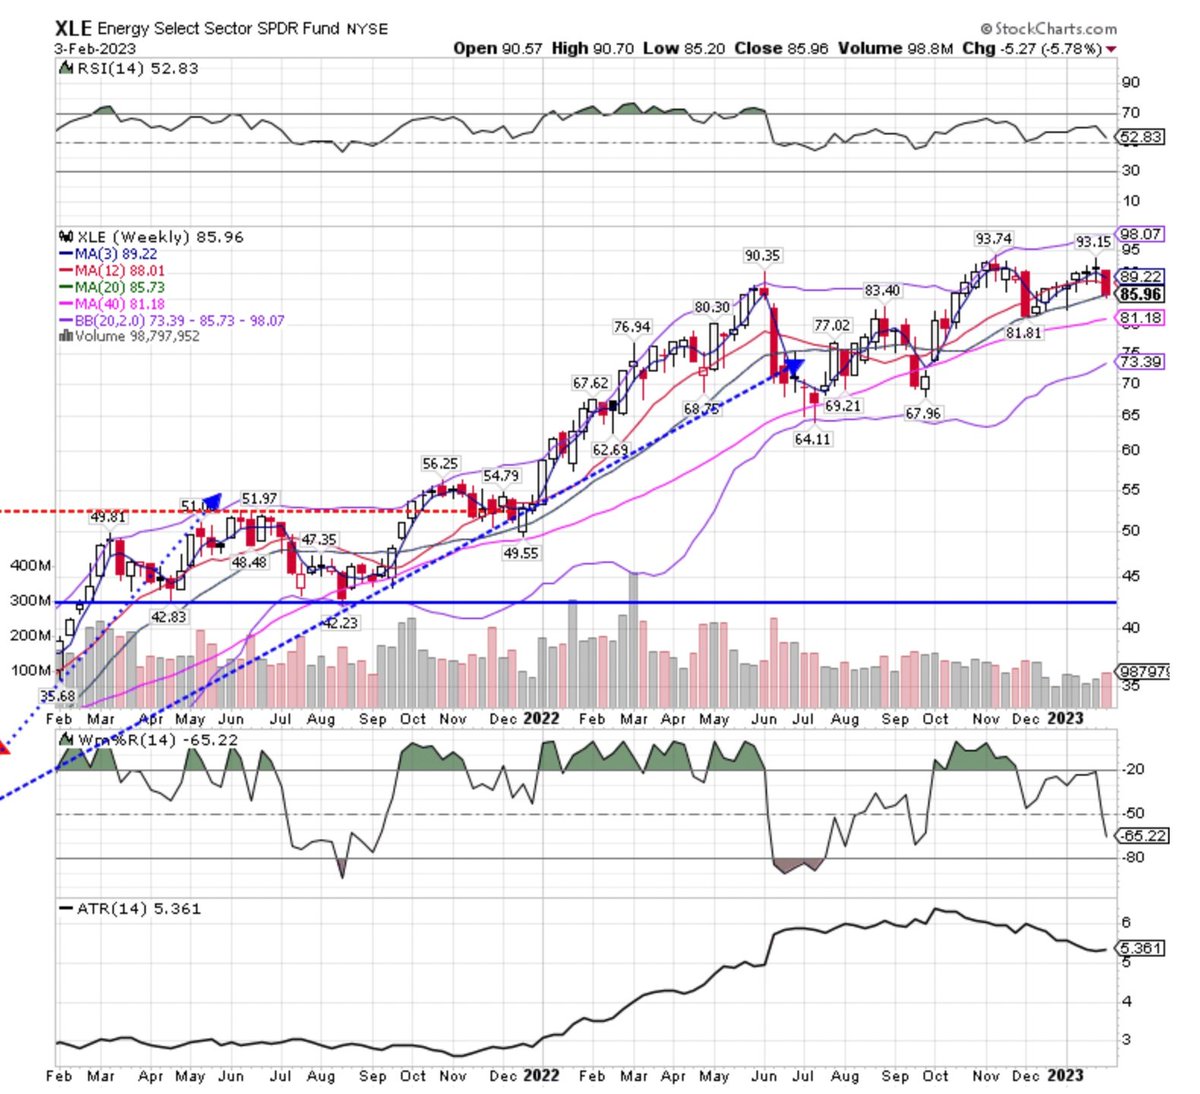
Beneath the surface in sector land, $XLC +5.26% and $XLK +3.71% (2022 laggards) led higher, while $XLE -4.41%
Chart: $XLE with a definitive “get out of Dodge” signal on the weekly
Beneath the surface in sector land, $XLC +5.26% and $XLK +3.71% (2022 laggards) led higher, while $XLE -4.41%
Chart: $XLE with a definitive “get out of Dodge” signal on the weekly

9/9
So, here we are with coincident and trailing data showing inflation 🔻 but the $ISM Services print giving cause for concern.
Will need to keep a sharp eye on the $USD as well as $TNX for the next move.
⚠️🚩 and have a super profitable 💰 week!
So, here we are with coincident and trailing data showing inflation 🔻 but the $ISM Services print giving cause for concern.
Will need to keep a sharp eye on the $USD as well as $TNX for the next move.
⚠️🚩 and have a super profitable 💰 week!
• • •
Missing some Tweet in this thread? You can try to
force a refresh


