Siamo a metà febbraio e sono passate altre due settimane di maratona per la stagione 2023 della #neve in Italia. ❄️
Aria fredda ma condizioni complessivamente asciutte, soprattutto sulle Alpi... Come sta andando il #deficit italiano di risorse idriche nivali?
Leggi il thread👇🧵
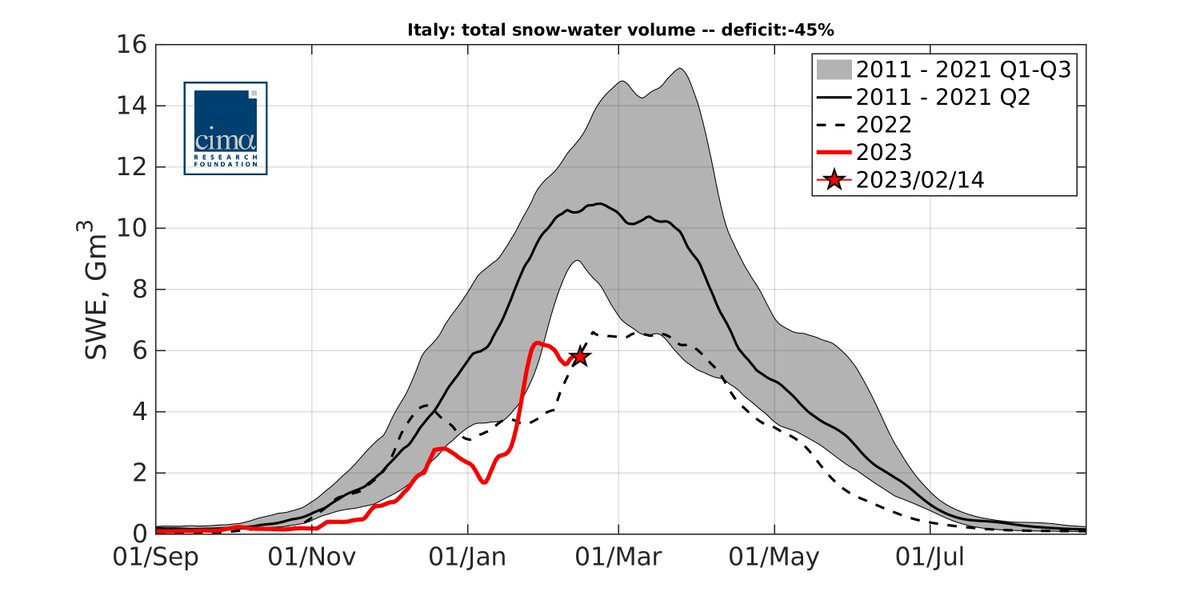
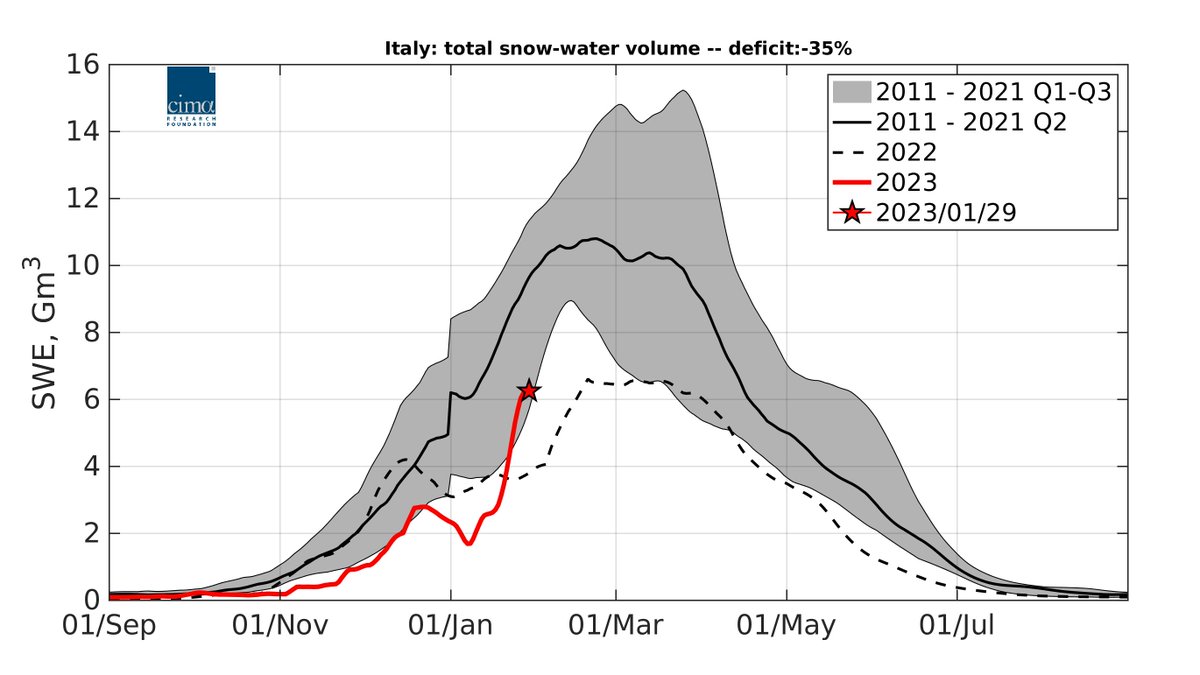
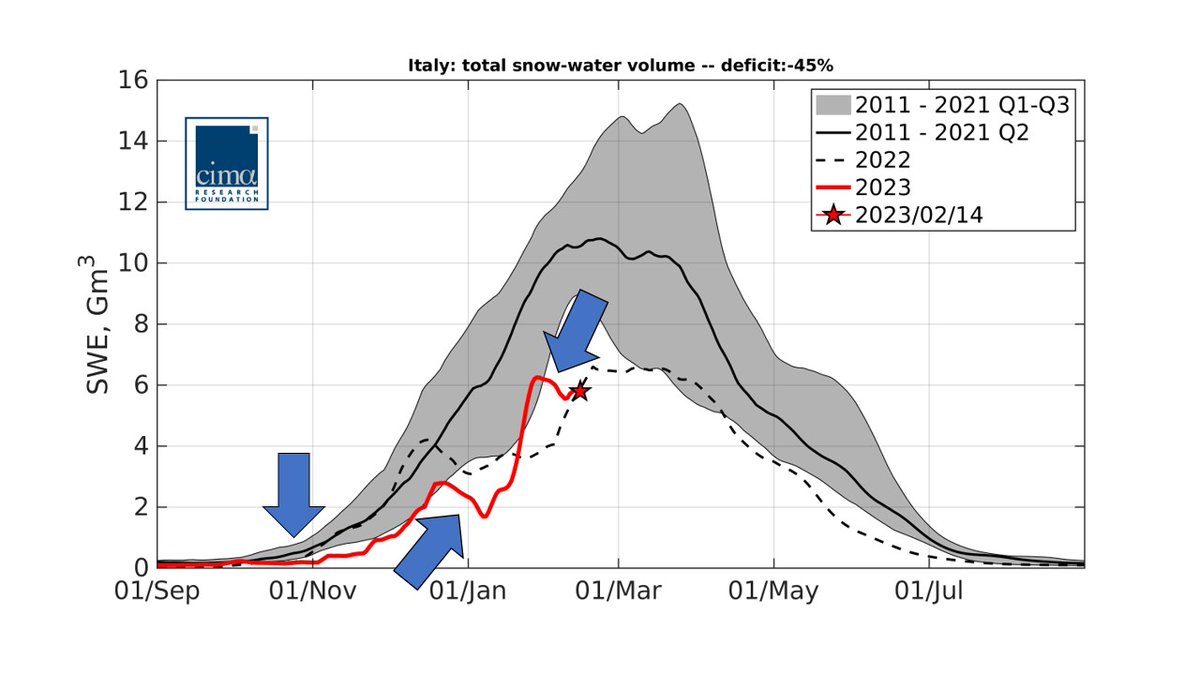
Non abbiamo visto molte nuove nevicate dopo la fine di gen. Al momento, quindi, stimiamo che le risorse idriche nivali su scala nazionale siano la metà rispetto al 2011-21 (deficit -45%).
A livello nazionale, le condizioni rimangono simili al 2022, un anno di #siccità rilevante👇
Un riepilogo su questo grafico 👆
L'asse X è il tempo, dall'autunno all'estate.
L'asse Y è lo Snow Water Equivalent, cioè quanta acqua abbiamo nella neve (più è alta, meglio è).
Linea nera: mediana per il periodo 2011-2021.
Linea rossa: 2023.
Linea tratteggiata: 2022.
Che dire di Q1 e Q3? Sono il 1° e il 3° quartile dello SWE storico. Se l'at-tuale SWE è sotto Q1 (come ora), siamo nel 25% degli anni con SWE più basso nei nostri 12 anni di storia.
Le condizioni “medie” sono comprese tra Q1-Q3; sopra a Q3 le stagioni con abbondanza di neve.
Perché siamo ancora in deficit nonostante il recente "freddo"? La #temperatura è un ingrediente della stagione nevosa, l'altro sono le #precipitazioni. Poche quest’anno, soprattutto sulle Alpi... Dopo un inizio tardivo e un fine anno caldo, questo è il 3° ritardo nella maratona.
Nel bacino del #Po, ad esempio, abbiamo 1/3 di neve rispetto all'ultimo decennio. Oggi stimiamo circa le stesse risorse idriche nivali dell'anno scorso e ci avviciniamo al periodo di massimo accumulo.
Il tempo per accumulare la neve sta finendo, inizierà a fondere in primavera.
La situazione è solo di poco migliore nel NE IT, dove stimiamo la metà delle risorse idriche nivali rispetto all'ultimo decennio nel fiume #Adige.
Qui, il deficit di neve è maggiore rispetto all'anno scorso, con oltre mezzo miliardo di m cubi d'acqua in meno rispetto al 2022.
I fiumi Po e Adige ospitano circa il 75% delle risorse idriche nivali nazionali al picco di accumulo. Nel Po, il volume di picco della neve può essere anche pari o superiore al 60% della portata annuale👇
Questo deficit di neve è l'acqua che avremo (o non avremo) in estate.
In IT centro-sud, la neve fonde rapidamente e raramente si protrae all'estate. Sul fiume #Tevere, ad es, siamo passati da un'anomalia positiva a un deficit del -34% in 10 gg.
La neve in aree con temperature e precipitazioni stagionali elevate è chiamata "marittima". Curioso, no?
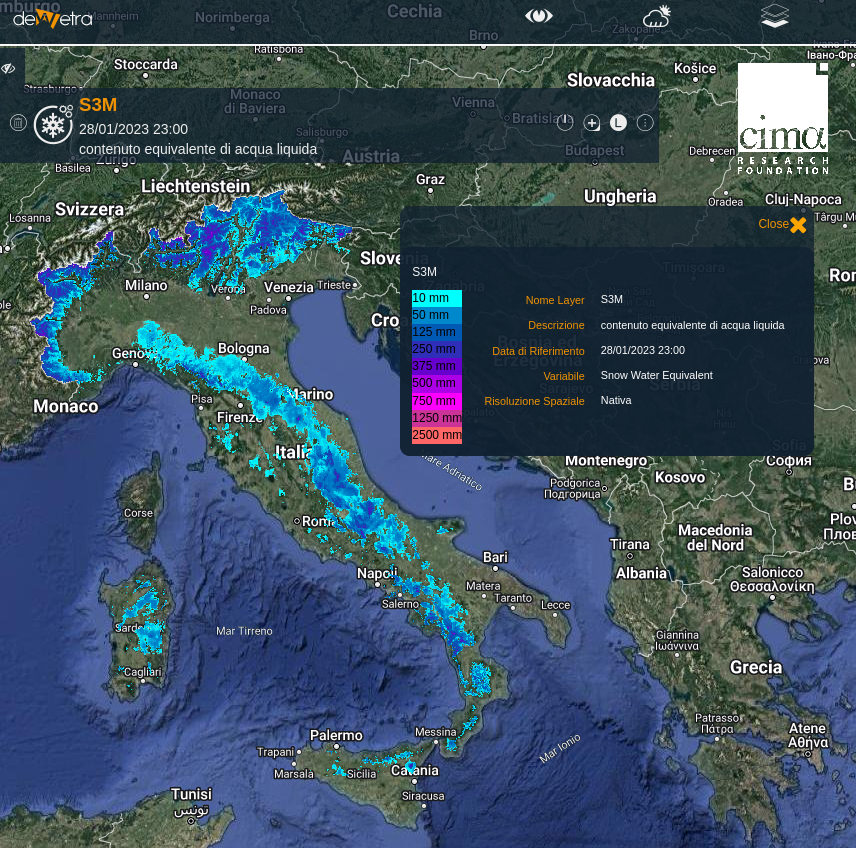
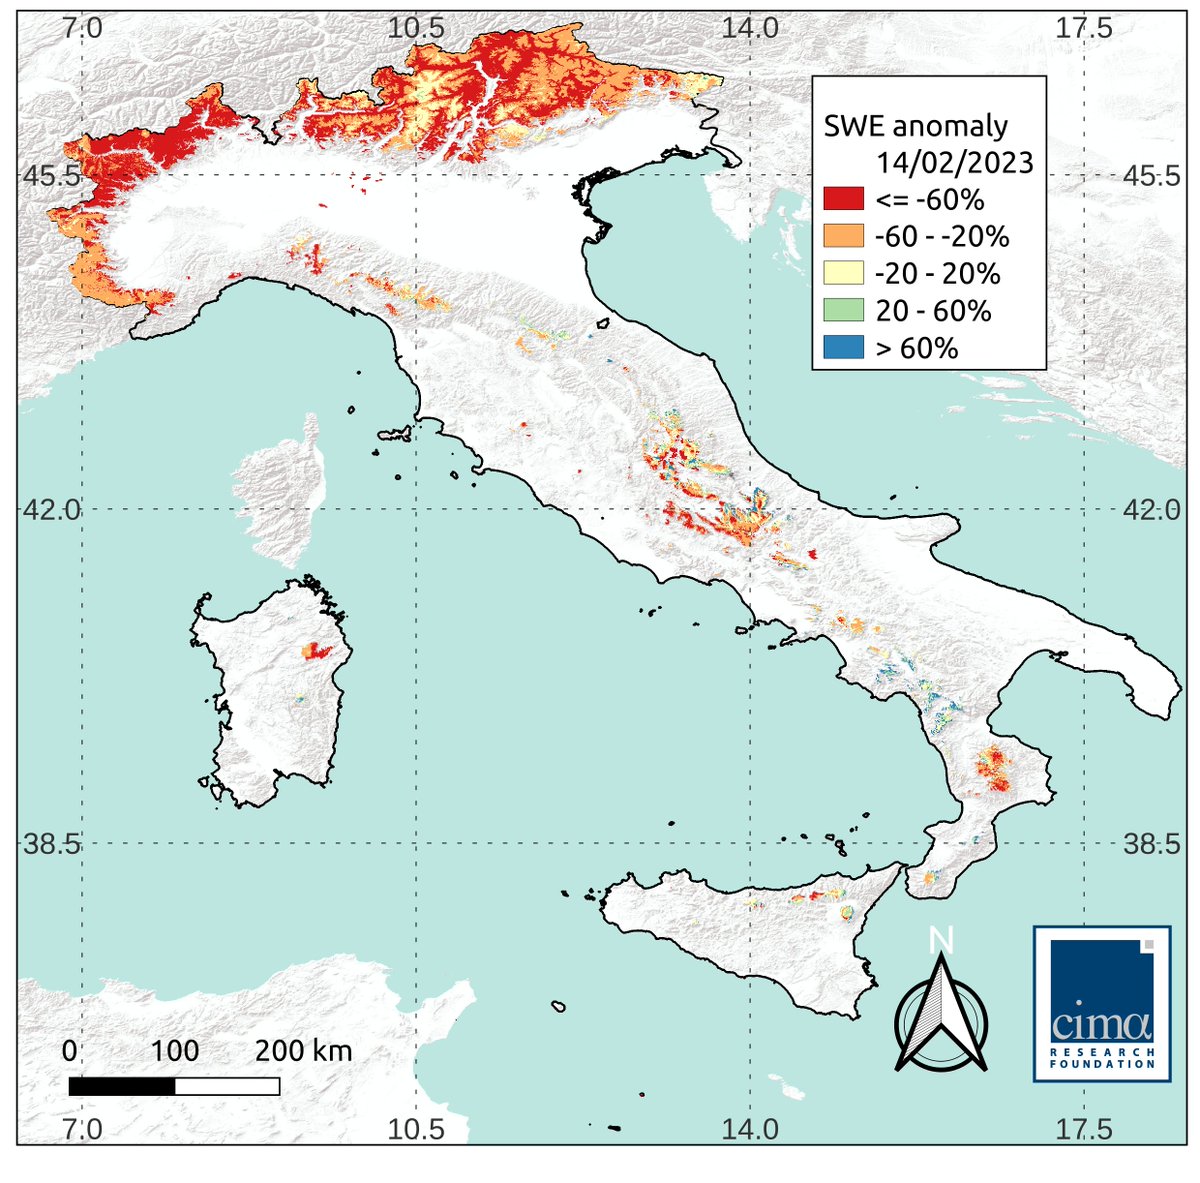
Ecco l'attuale mappa del deficit nazionale di risorse idriche nivali. Il rosso indica aree con quantità di neve inferiore al 2011-21. Le nevicate di fine gen hanno migliorato un po' la situazione nelle Alpi sud-ovest, ma il deficit rimane elevato nelle Alpi nord-ovest e centrali.
Due variabili da tener presenti se si parla di neve e risorse idriche: l'estensione (dove) e la profondità della neve (quanta). Alimentando i nostri modelli fisici con immagini satellitari e rilievi a terra, IT-SNOW fornisce le informazioni in tempo reale: bit.ly/3E8b2gI
Dal punto di vista storico, rimane circa un mese per l'accumulo di neve, dato che il picco di accumulo in Italia si verifica il 4 marzo ± 10 giorni.
🔜 Pubblicheremo un'altra valutazione dopo il giorno del picco di accumulo.
See you on the other side!
👉 cimafoundation.org/news/neve-gli-…

• • •

Missing some Tweet in this thread? You can try to force a refresh
 

Keep Current with CIMA Research Foundation

CIMA Research Foundation Profile picture

Stay in touch and get notified when new unrolls are available from this author!

Read all threads

This Thread may be Removed Anytime!

PDF

Twitter may remove this content at anytime! Save it as PDF for later use!

Try unrolling a thread yourself!

how to unroll video
  1. Follow @ThreadReaderApp to mention us!

  2. From a Twitter thread mention us with a keyword "unroll"
@threadreaderapp unroll

Practice here first or read more on our help page!

More from @CIMAFoundation

Feb 16
It’s mid-Feb and two more weeks have passed in the 2023 Italian #snow-season marathon. Mixed weather, with cold air but overall dry conditions – especially in the Alps.
So, how is the Italian deficit in snow-water resources doing at the moment?

A thread 👇🧵
We haven’t seen much new snow since late-January snowfalls, and thus estimate half of snow water resources at national scale compared to 2011-21 (deficit: -45%). At national scale, conditions remain similar to 2022, which was already a significant #drought year. 👇
A recap about this plot 👆
X axis is time, from autumn to summer.
Y axis is Snow Water Equivalent, i.e., how much water we have in snow (the higher, the better).
Black line: median for 2011-2021; red line: 2023; dashed line: 2022.
Read 12 tweets
Feb 13
#Climatechange, combined with continued development and urbanization in some areas, has increased the risk of 𝐟𝐥𝐮𝐯𝐢𝐚𝐥 𝐟𝐥𝐨𝐨𝐝𝐢𝐧𝐠 in much of #Europe; and, despite extensive efforts to reduce the #risk, #flood impacts have increased in recent decades. Image
The climate crisis makes it increasingly urgent and necessary to put #adaptation strategies, as well as #mitigation, at the center of policies.
So what type of adaptation? How can we, in the face of different risks, identify the most effective #strategies?
A new study in @NatureClimate, co-authored by our Francesco Dottori and Lorenzo Alfieri, focuses on river flooding: simulating different types of interventions, they present a cost-benefit analysis to identify the best strategies for limiting land vulnerability to #flood #risk. Image
Read 4 tweets
Jan 31
Tre settimane fa abbiamo pubblicato la nostra prima valutazione delle risorse idriche nivali italiane del 2023 e abbiamo parlato di un forte deficit. Come vanno le cose ad oggi, dopo quale giorno freddo e nevoso?

Leggi il thread!🧵👇
Vedrete molti grafici come questo👇
L'asse X è il tempo, dall'autunno all'estate.
L'asse Y è lo Snow Water Equivalent, una misura di quanta acqua abbiamo nella neve (qui in tutta Italia).
La linea nera è una media per 2011-2021, la rossa è il 2023, quella tratteggiata il 2022.
I dati provengono da S3M Italia, strumento operativo in tempo reale sviluppato da noi per @DPCGov per quantificare le risorse idriche nivali con modelli fisici, dati satellitari e misure al suolo. Le abbiamo simulate dal 2010 e i dati sono disponibili qui: bit.ly/3GZRVWD
Read 13 tweets
Jan 31
Quite cold & snowy days over Italy! Three weeks ago we published our first assessment of 2023 Italian #snow water resources and we reported a significant deficit. How are things going after recent snowfalls?

A thread! 🧵👇
🔑 You’ll see many plots like this one👇
X axis is time, from autumn to summer.
Y axis is Snow Water Equivalent, i.e., how much water we have in snow (across all Italy in this case).
The black line is a median for 2011-2021, the red line is 2023, the dashed line is 2022.
These data come from S3M Italy, a real-time operational tool we developed for the Italian @DPCgov to estimate snow water resources using models, satellite data and ground measurements. We simulated since 2010 & data are freely available here: bit.ly/3GZRVWD
Read 13 tweets
Jan 9
Italy is facing another severe deficit in #snow water resources in 2023. We all see landscapes with scarce snow, but we also know that snow accumulation can change significantly from one year to the others. So, how serious is the situation at the moment?

Thread below! 🧵👇
There are two variables we should keep in mind when thinking about snow: snow extent (where?) and snow depth (how much?). By feeding physical models with satellite images, IT-SNOW provides both information in real time. Thus, how much water in snow are we missing at the moment?
According to our estimates, we are currently missing about 69% of water from snow at national scale. In other words: we are experiencing a larger deficit than last year, which was already an historical drought year.
Read 7 tweets
Jan 9
L'Italia sta affrontando un altro grave deficit di risorse idriche da #neve nel 2023. Vediamo paesaggi con poca neve, ma sappiamo anche che l'accumulo di neve può cambiare significativamente da un anno all'altro. Quindi quanto è grave la situazione al momento?
Segui il thread👇🧵
Ci sono due variabili da tenere presenti quando si parla di neve e risorse idriche: l'estensione (dove) e la profondità della neve (quanta). Alimentando i nostri modelli fisici con le immagini satellitari, IT-SNOW fornisce entrambe le informazioni in tempo reale.
Ma quindi, quanta neve ci manca al momento? Secondo le nostre stime, attualmente ci manca circa il 69% dell'acqua accumulata nella neve a scala nazionale. In altre parole, stiamo registrando un deficit maggiore rispetto all'anno scorso, che è già stato un anno storico di #siccità
Read 7 tweets

Did Thread Reader help you today?

Support us! We are indie developers!


This site is made by just two indie developers on a laptop doing marketing, support and development! Read more about the story.

Become a Premium Member ($3/month or $30/year) and get exclusive features!

Become Premium

Don't want to be a Premium member but still want to support us?

Make a small donation by buying us coffee ($5) or help with server cost ($10)

Donate via Paypal

Or Donate anonymously using crypto!

Ethereum

0xfe58350B80634f60Fa6Dc149a72b4DFbc17D341E copy

Bitcoin

3ATGMxNzCUFzxpMCHL5sWSt4DVtS8UqXpi copy

Thank you for your support!

Follow Us on Twitter!

:(