As the #rstats course material is not public (yet?) or available as online training (yet?), I thought I am sharing some slides from the deck.
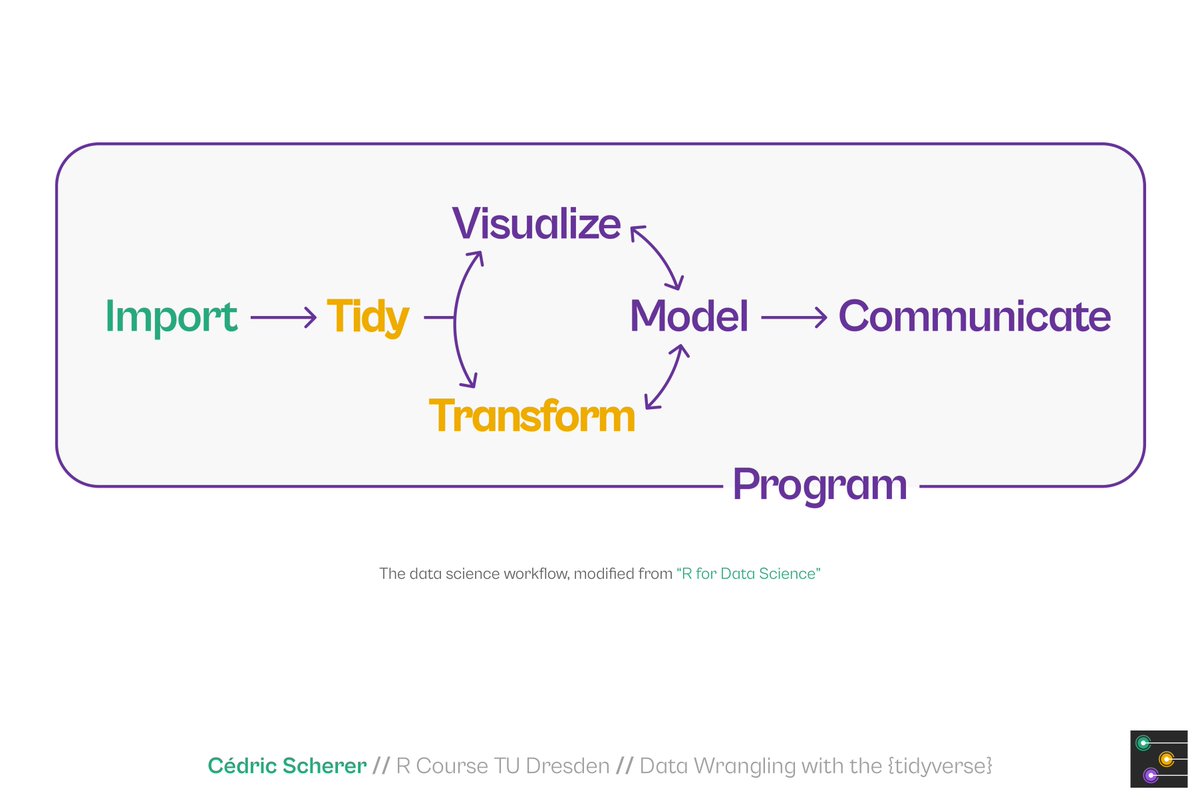
The course covers all steps of the #DataScience workflow as featured in @hadleywickham's fantastic #R4DS 📕 r4ds.had.co.nz/index.html
The course covers all steps of the #DataScience workflow as featured in @hadleywickham's fantastic #R4DS 📕 r4ds.had.co.nz/index.html


The fundamentals of R includes:
* values
* assignments and objects
* functions
* data types
* unknown values
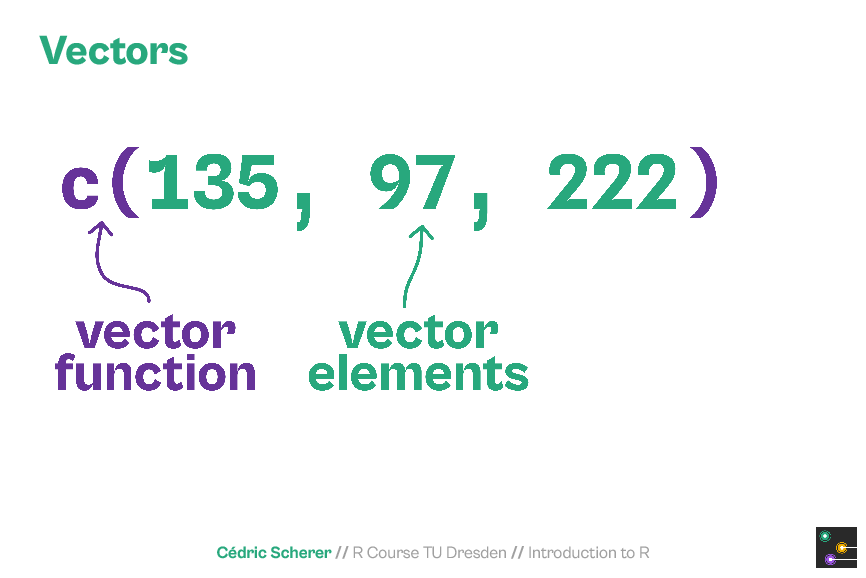
* vectors
* factors
* packages
* tabular data
* data generation
* data import
* values
* assignments and objects
* functions
* data types
* unknown values
* vectors
* factors
* packages
* tabular data
* data generation
* data import


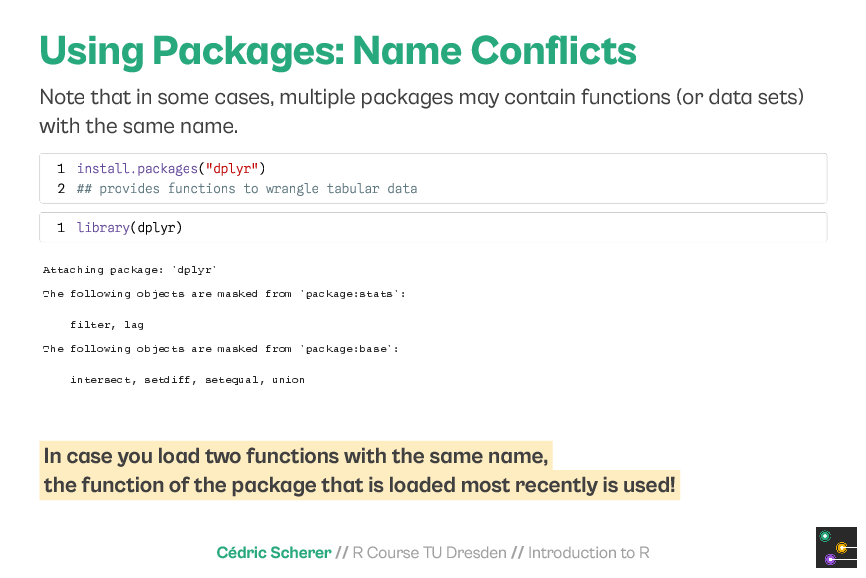
We also covered, among other topics, naming conventions, coercion, name conflicts, ...


... tibbles as modern implementation of data frames, retrieving basic summaries of data sets, potential problems, and discussed resources to find help.


Ay, just realize the crappy image resolution... Sorry, going to prepare better ones for the other sessions.
Time for session 2:
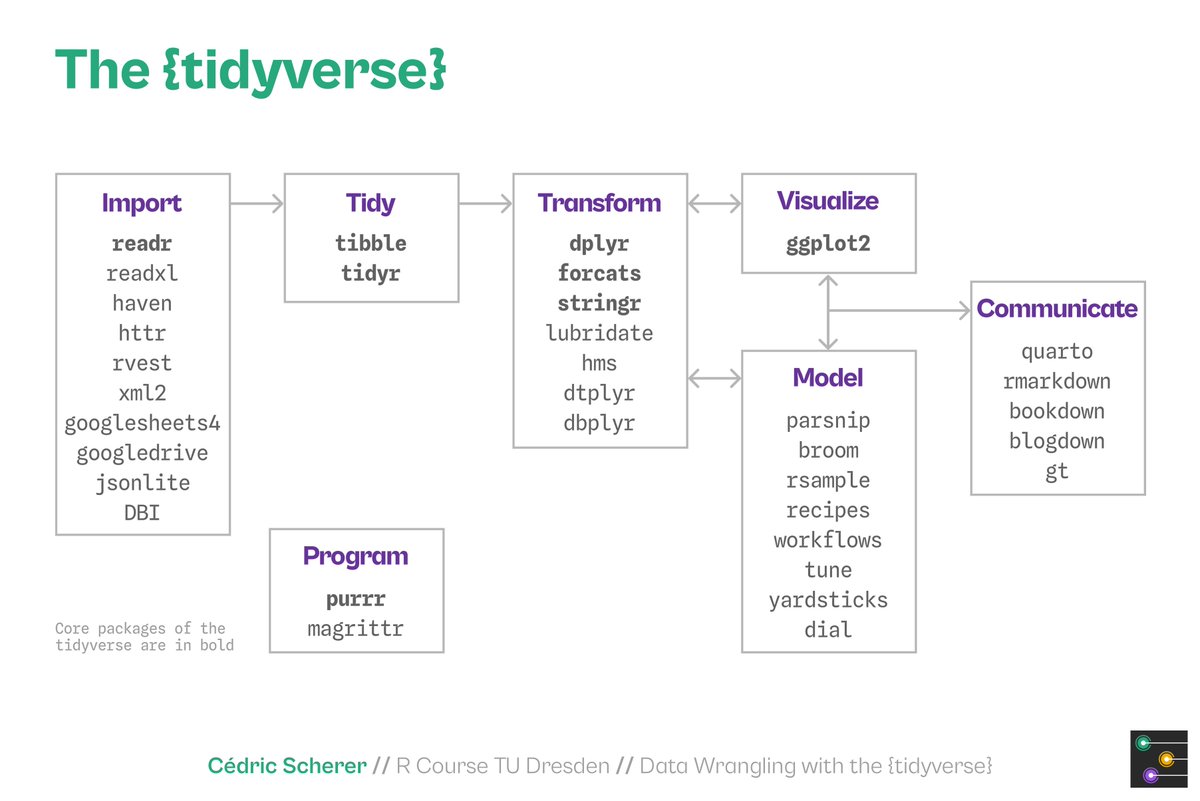
"Data Wrangling with the {tidyverse}*"
This time with slides in better quality.
* I know it's a bit too broad but as we use multiple packages such as dplyr, tidyr, forcats, and stringr (and strictly speaking tibble as well) I went for this session name.
"Data Wrangling with the {tidyverse}*"
This time with slides in better quality.
* I know it's a bit too broad but as we use multiple packages such as dplyr, tidyr, forcats, and stringr (and strictly speaking tibble as well) I went for this session name.


Some analysis and #dataviz might be possible without (re)shaping and/or summarizing your data—especially also thanks to #ggplot2's powerful stat functionality—but often we need to prepare our data for the next steps. You can do it in #Excel but we, of course, use #rstats


Of course, we start with THE main package for data wrangling in the #tidyverse collection: the #dplyr 📦 and its main verbs
(Credit to @allison_horst for her lovely illustrations that are featured across all sessions 🙌)
(Credit to @allison_horst for her lovely illustrations that are featured across all sessions 🙌)


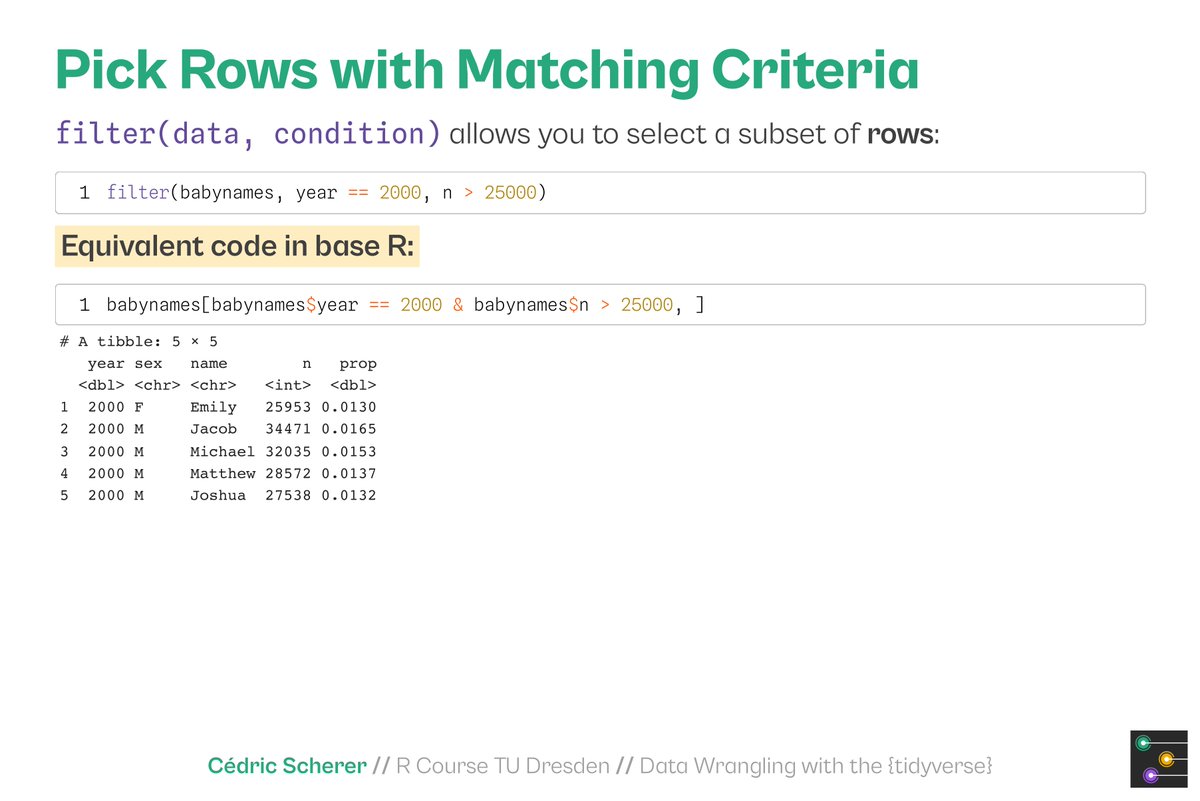
I always share the equivalent #baseR code (not everyone loves the #tidyverse 😱) and show the basic and a bit more advanced usage of the main verbs--and of course group_by and how it gives you SUPERPOWER!! 🦹♀️🦸♂️


How to bring it all together? Pipe it!


In the following, a few more functions (and #tidyverse packages) that help when cleaning data (feel free to share your favorites, those are the ones I am using regularly)


#tidyr: pivoting is though but so important and powerful


#forcats: suddenly working with factors became one of my favorite tasks in R! 🤯
And it's so important in combination with #ggplot2 as well:
And it's so important in combination with #ggplot2 as well:


#lubridate: working with dates became so simple as well as I've never been a fan of POSIXct/lt and Co.
Plus #hms for working with timestamps.
Plus #hms for working with timestamps.


• • •
Missing some Tweet in this thread? You can try to
force a refresh