New Report: Were Americans more informed about police shootings in 2022 than 2020?

In both years, we asked people to estimate how many unarmed black men were killed by police during the previous year.

Here's what we found.

#police #racism #politics
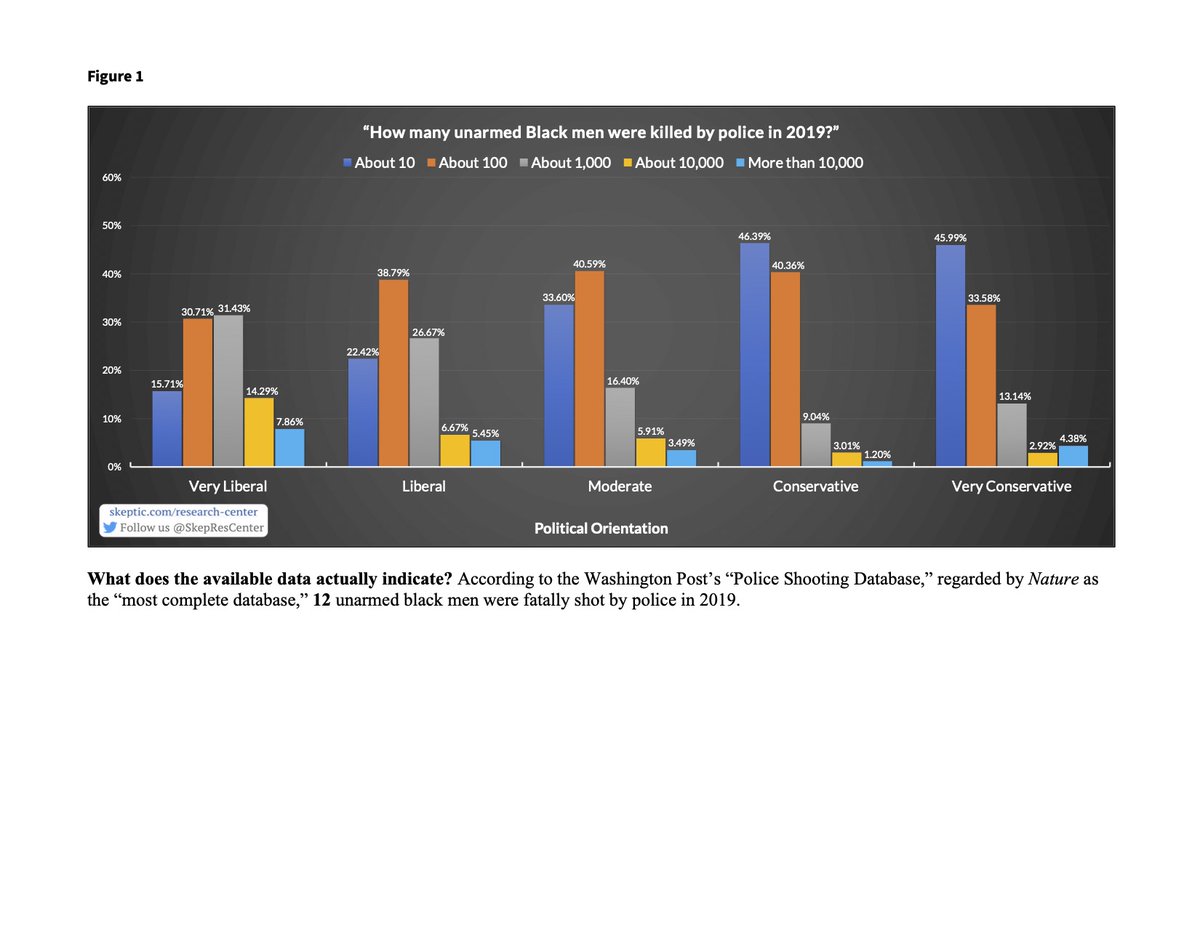
2020 Survey: "How many unarmed black men were killed by police in 2019?"

The Washington Post's police shooting database says 12.

54% of "Very Liberals" (least accurate) estimated 1,000+.

13% of "Conservatives" (most accurate) estimated 1,000+.
2022 Survey: “How many unarmed black men were killed by police in 2021?”

The Washington Post's police shooting database says 11.

40% of "Very Liberals" (least accurate) estimated 1,000+.

16% of "Very Conservatives" (most accurate) estimated 1,000+.
2020 & 2022 Surveys Compared

There was a modest improvement in accuracy.

The greatest improvement occurred among “Very Conservatives.”

While liberals increased how often they gave the false answer of “About 100,” they gave even more extreme answers less often.
Why are people are so misinformed about this?

What caused accuracy to slightly improve since 2020?

We'd love to hear your feedback!

We are an #antipartisan research team. You can support us by sharing our work!

Free full PDF research report: buff.ly/3MgZxZa

• • •

Missing some Tweet in this thread? You can try to force a refresh
 

Keep Current with Skeptic Research Center Team

Skeptic Research Center Team Profile picture

Stay in touch and get notified when new unrolls are available from this author!

Read all threads

This Thread may be Removed Anytime!

PDF

Twitter may remove this content at anytime! Save it as PDF for later use!

Try unrolling a thread yourself!

how to unroll video
  1. Follow @ThreadReaderApp to mention us!

  2. From a Twitter thread mention us with a keyword "unroll"
@threadreaderapp unroll

Practice here first or read more on our help page!

More from @SkepResCenter

Apr 3
Do men have more trust in social institutions than women?

We surveyed people to find out. Here are our results.

#politics #gender #trust Image
In 2020, we asked 1401 men and women how much they trusted:

– News Media
– Political Officials
– Hospitals & Doctors
– Educational Institutions

The most trusted on average was Hospitals & Doctors..

Political Officials was least trusted overall. Image
We compared men and women's average scores across all social institutions.

We found that, in 2020, Democratic and Republican women both reported lower trust than their male counterparts. Image
Read 5 tweets
Apr 3
Did Democrats care more about racism than Covid?

Did Republicans value the economy over stopping the spread?

We asked over 1,000 Democrats and Republicans about their priorities during Fall 2020.

Here's what we found.

#Covid #racism #economy Image
Covid vs Racism.

Most Democrats and Republicans said fighting Covid was more important than protesting against racism.

About 15% of Democrats said protesting racism was more important. Image
Covid vs Economy.

People largely agreed with 80% of Democrats and over 60% of Republicans saying that fighting Covid was more important than reducing the unemployment rate. Image
Read 5 tweets
Apr 3
Are Democrats more tolerant of Republicans than vice versa? Are you more politically tolerant than average? We surveyed people to find out. Here are our results. 🧵 Image
How irritated would you be if a member of your least favorite political party was dating a member of your family? was your neighbor? co-worker? local elected official?

We averaged answers to ^these q's to measure political tolerance.

+2 = max tolerance.
-2 = max intolerance. Image
We found that D's and R's were tolerant of each other, on average. There was no statistically significant difference in tolerance between D's and R's in either 2019 or 2020. Image
Read 6 tweets
Apr 2
What impacts a political party's level of infighting? We asked Democrats and Republicans how they felt about the parties in 2019 and 2020. How did the events of those years impact party unity? Here's what we found. 🧵 #politics Image
We asked two samples, one in Fall 2019 and another in Fall 2020, which political group held views most opposed to their own. In our '19 survey, we found that Dems were almost as opposed to their OWN party as they were to the Rep party (top right). Image
~55% of Reps in '19 agreed the Dem Party held the most opposed views. That decreased to ~41% in '20. Which events do you think drove these changes? A lot happened between Fall 2019 and Fall 2020. Image
Read 4 tweets
Mar 6
NEW REPORT about Americans' views on gender identity and #trans issues is out now. This data is from a survey of over 3,000 adults conducted last fall. Here's what we found. (1/8) #LGBTQ #Transgenderism
True or false: "Transgender women are biological women." About one in four zoomers said "true." The majority of people said "false," regardless of age. (2/8) Image
Same question broken down by political orientation. The majority of respondents within each category said "false." Over a third of adults who identified as "very liberal" said "true." (3/8) Image
Read 8 tweets

Did Thread Reader help you today?

Support us! We are indie developers!


This site is made by just two indie developers on a laptop doing marketing, support and development! Read more about the story.

Become a Premium Member ($3/month or $30/year) and get exclusive features!

Become Premium

Don't want to be a Premium member but still want to support us?

Make a small donation by buying us coffee ($5) or help with server cost ($10)

Donate via Paypal

Or Donate anonymously using crypto!

Ethereum

0xfe58350B80634f60Fa6Dc149a72b4DFbc17D341E copy

Bitcoin

3ATGMxNzCUFzxpMCHL5sWSt4DVtS8UqXpi copy

Thank you for your support!

Follow Us on Twitter!

:(