On Business #Sales
1. While #households create most of the spending in the economy, businesses engage in investment and employment to generate profits. Therefore, sustained #consumption is contingent upon companies using labor to create output.
1. While #households create most of the spending in the economy, businesses engage in investment and employment to generate profits. Therefore, sustained #consumption is contingent upon companies using labor to create output.

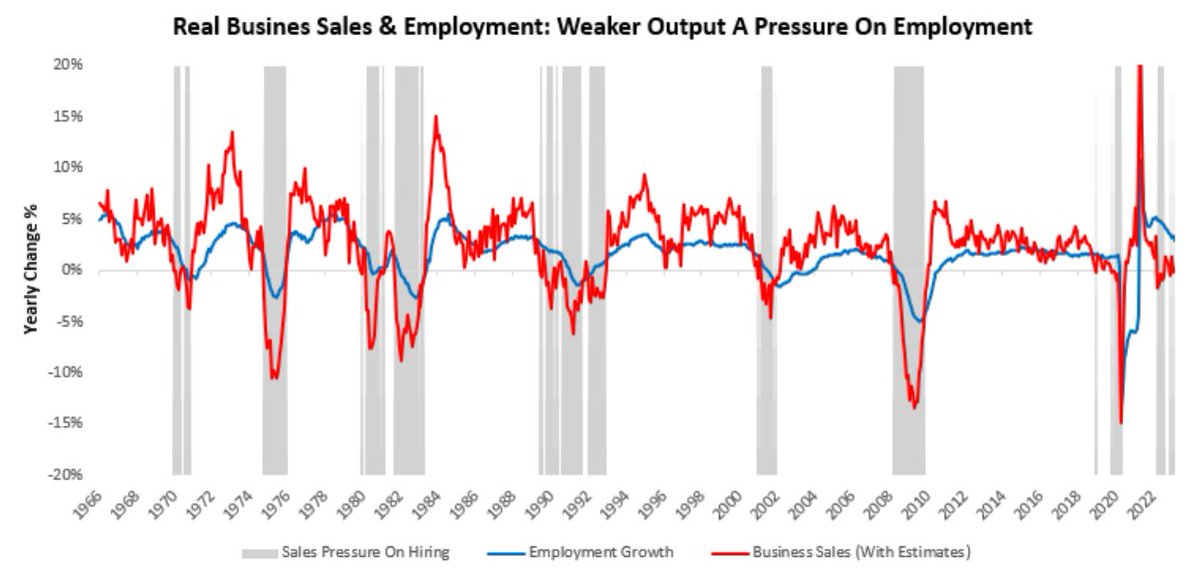
2. Typically, when output has declined, employment has followed suit. We show this in the visualization above.
3. In the visualization presented in 1. we show howe show how periods of decline in real business sales (i.e., business output) create pressure on employment growth. Every period of protracted contraction in real sales has resulted in an eventual contraction in unemployment.
4. Last year, we saw the initial flirtation with a meaningful contraction in real business sales; however, this decline was driven primarily by #price shocks rather than meaningful declines in nominal #spending.
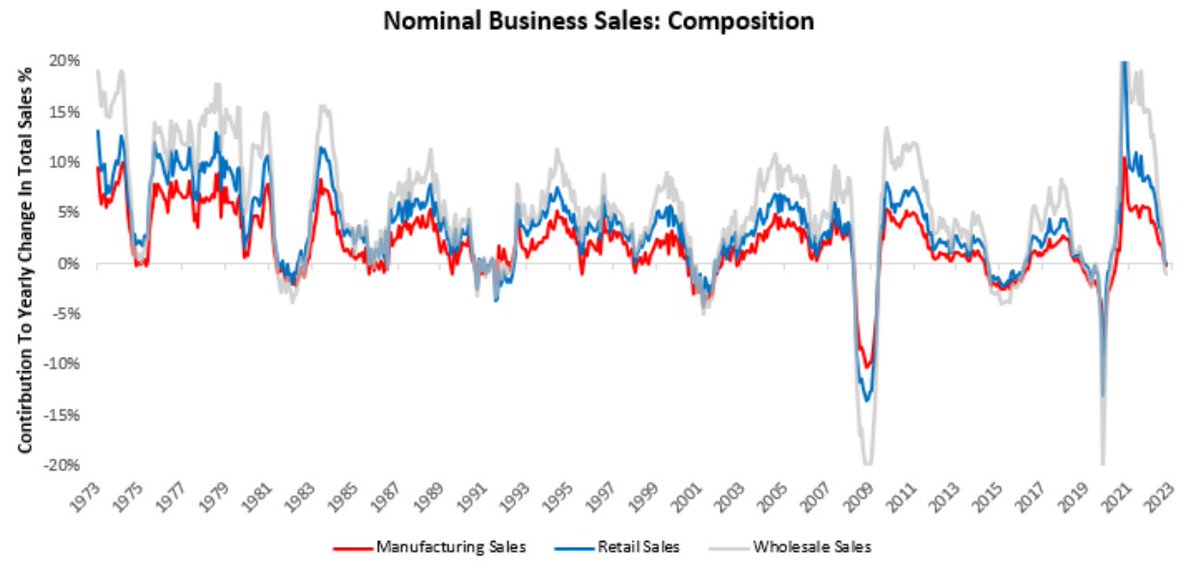
5. Fast forward to today, and the picture looks quite different, with nominal business sales looking weak across the board. 

6. Above, we show nominal business sales split into manufacturing, retail, and wholesale sales. We can see that conditions across these segments are weak, even in nominal terms. We zoom into each sector to offer some additional detail. We begin with retail sales.
8. Zooming out, we see a significant source of strength in nominal #spending has been #food services, an area acutely impacted by price shocks in the #commodity complex. 

9. We think it is important to note that retail sales are directly tied to the health of the consumer, and even despite a healthy consumer sector, many areas of retail sales are seeing nominal sales contracting.
10. We show below how half of the retail sales basket is in contraction while the other half is in #expansion: 

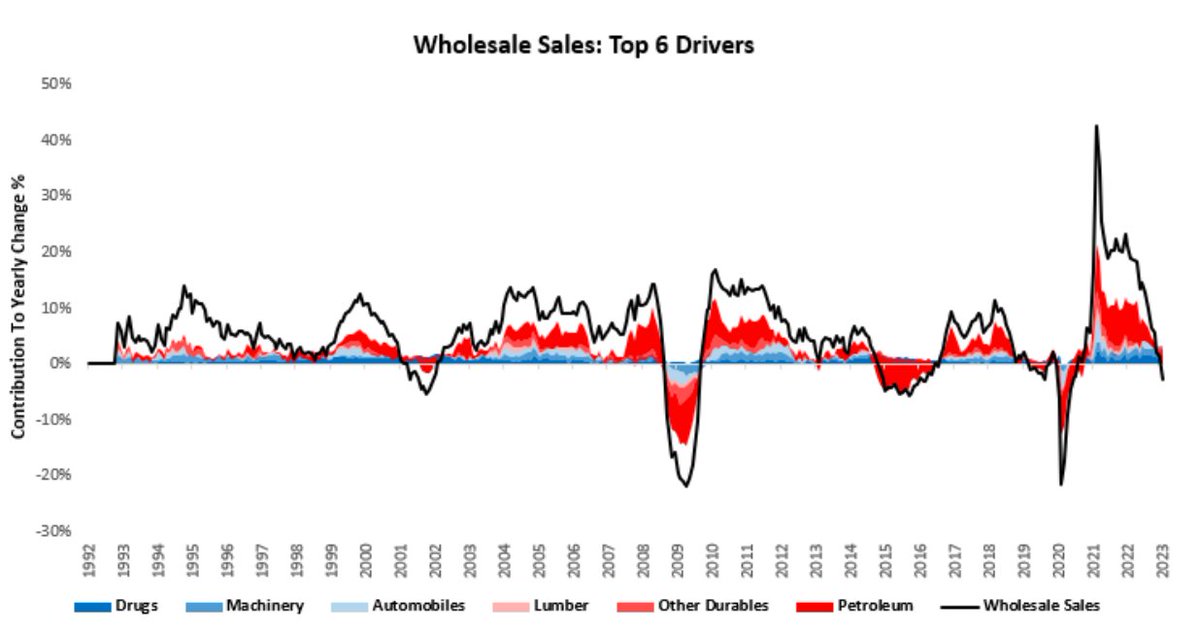
11. This picture gets worse when we look at sales conditions for #wholesalers. Over the last year, wholesale sales have contracted by -2.93%.
12. Below, we zoom out to show the six major drivers of strength in shades of blue (Drugs, Machinery & Automobiles) and weakness in shades of red (Lumber, Other Durables & Petroleum): 

13. We note that automobile demand remains strong, which speaks to the sustained shortages of #automobile inventories for businesses.
14. Our most recent data for wholesalers is significantly lagged, with the latest reading for March. The latest data showed that wholesale sales decreased by -2.09%. Below, we show the composition of these sales over the most recent month: 

15. Corroborating further weakness in business sales were the significant declines in #manufacturing sales, which again reflect weak business activity. The latest data for April showed that manufacturing sales decreased by -9.02%. 

16. As we can see above, manufacturing sales losses were broad-based in April, consistent with broad-based declines over the last year. Over the last year, manufacturers' sales have contracted by -2.13%.
17. Below, we zoom out to show the six major drivers of strength in m shades of blue (Transportation equipment, Beverage and tobacco products, and Electrical equipment & appliances) and weakness in shades of red (Primary metal, Plastics & Rubber, and Petroleum & Coal): 

18. Overall, these dynamics suggest a broad spectrum of #weak nominal business sales which are bound to create headwinds for businesses.
• • •
Missing some Tweet in this thread? You can try to
force a refresh

 Read on Twitter


