,
9 tweets,
4 min read
Read on Twitter
In their recent study on polygenic prediction of 21 alcohol-related diseases using a 1.1M SNP polygenic risk score for alcohol consumption, @samrip and colleagues assess predictive performance using 3 metrics. They don't explain why these 3 ...
1/
biorxiv.org/content/10.110…
1/
biorxiv.org/content/10.110…
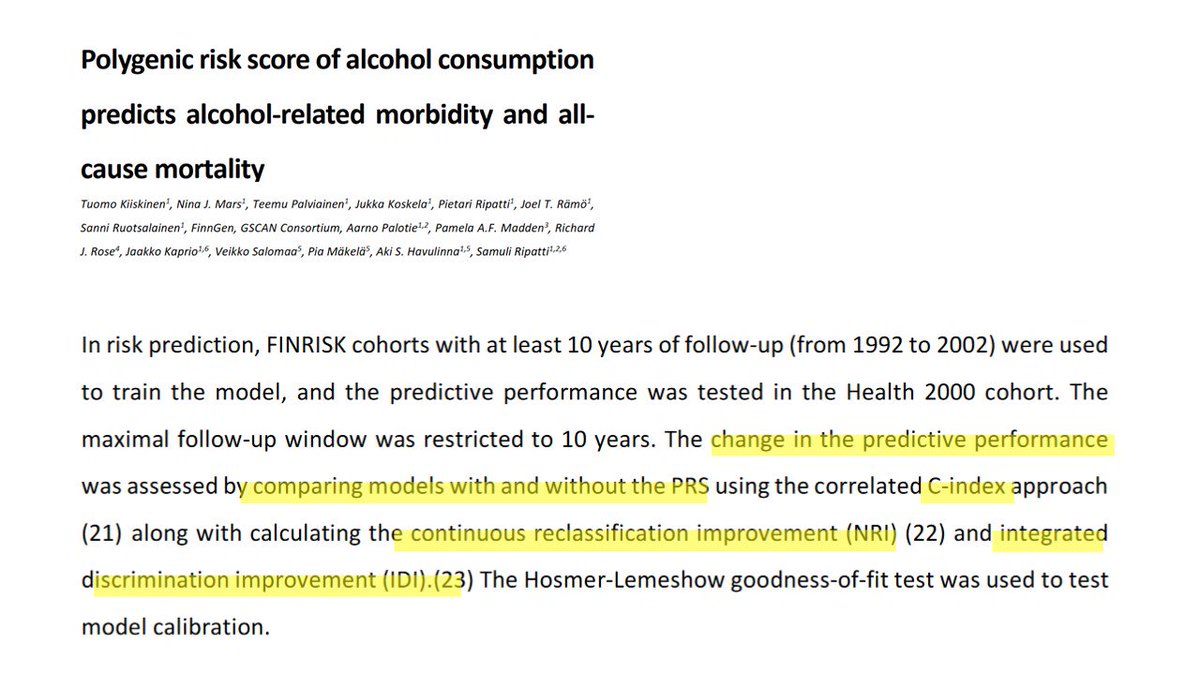
... and don't clarify what their values mean and how they should be interpreted. For example, what does it mean when NRI is 0.335? And what when IDI is 0.00331?
2/
2/

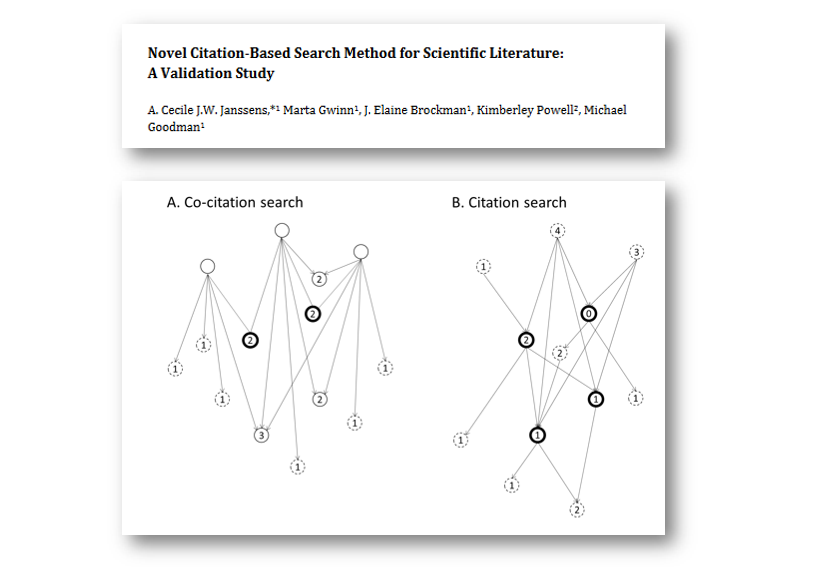
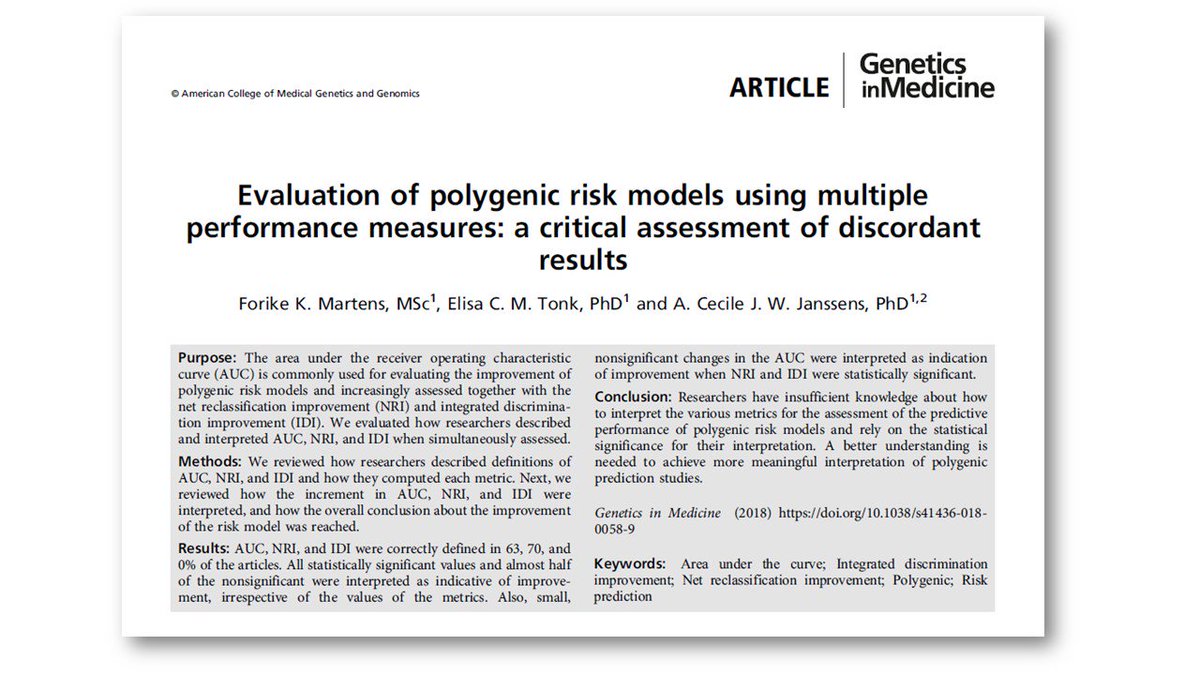
Before I explain: the lack of clarification is common. Researchers who use the c-index, NRI, and IDI simultaneously frequently have difficulty interpreting their findings. We found that they often rely on p-values instead.
3/
nature.com/articles/s4143… w/ @forikemartens
3/
nature.com/articles/s4143… w/ @forikemartens
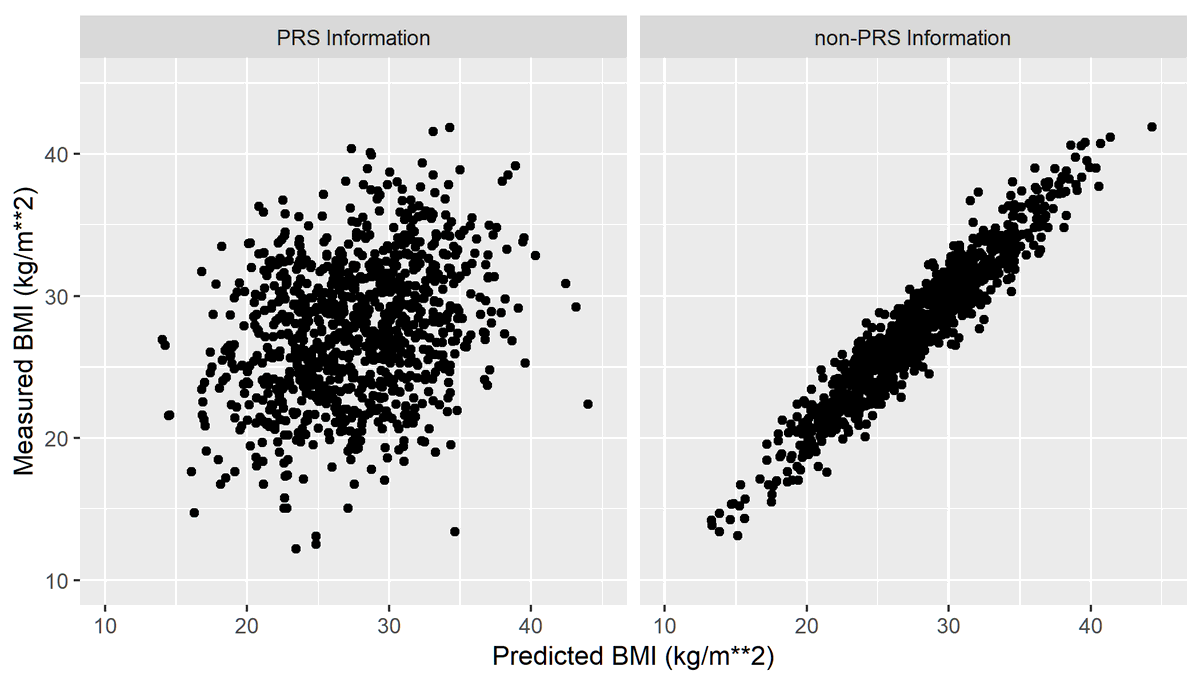
C-index assesses discrimination, the separation between the risk distributions of people with and without disease. High increase in c-index is needed to change the identification of high risk. +0.02, as here, unlikely has clinical utility. Read more:
4/
4/
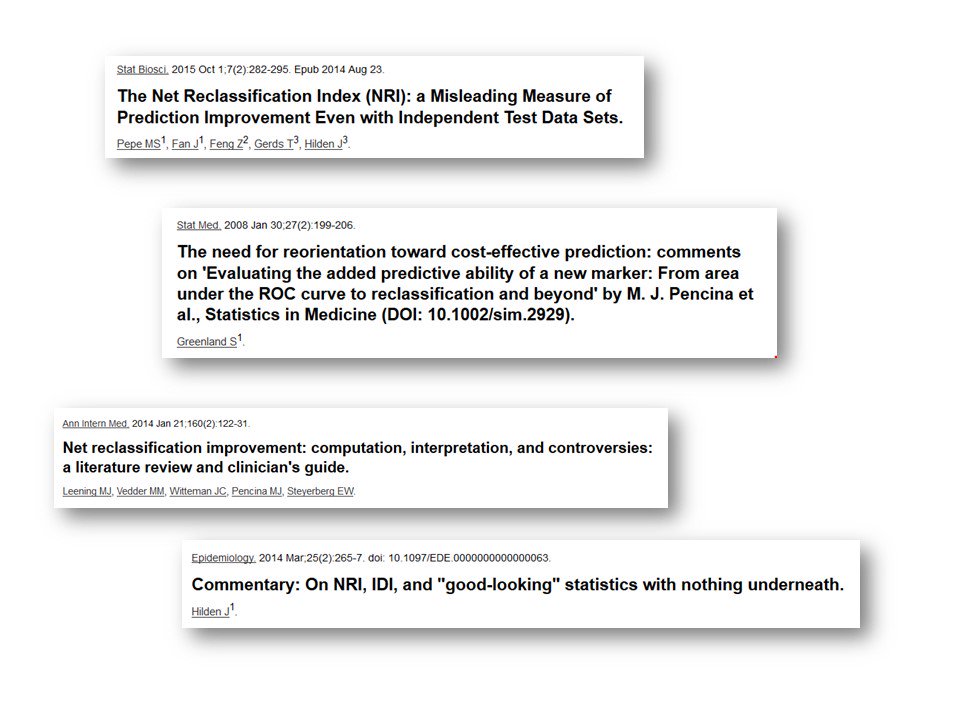
Categorical NRI assesses reclassification of participants between risk categories. Reclassification is a useful concept, but the metric is flawed: it adds apples and oranges. For more on NRI:
5/
5/
The researchers here used continuous NRI, which has the same shortcomings plus that its value highly depends on the number of digits behind the decimal point in the risk calculation. Their NRI was up to 0.335, which means that 33.5% of ... ??? (NRI values can't be explained)
6/
6/

IDI quantifies the difference (improvement) in risk differences before and after adding PRS to the model.
Here, IDI was 0.002 which means that the difference in mean risk between people with and without the disease became only 0.2% larger after adding PRS.
7/
Here, IDI was 0.002 which means that the difference in mean risk between people with and without the disease became only 0.2% larger after adding PRS.
7/

Statistical significance makes it tempting to overinterpret findings, but the best is to ignore NRI and small values of the IDI. The interpretation can be simplified by limiting all values to two digits behind the decimal point.
8/
8/

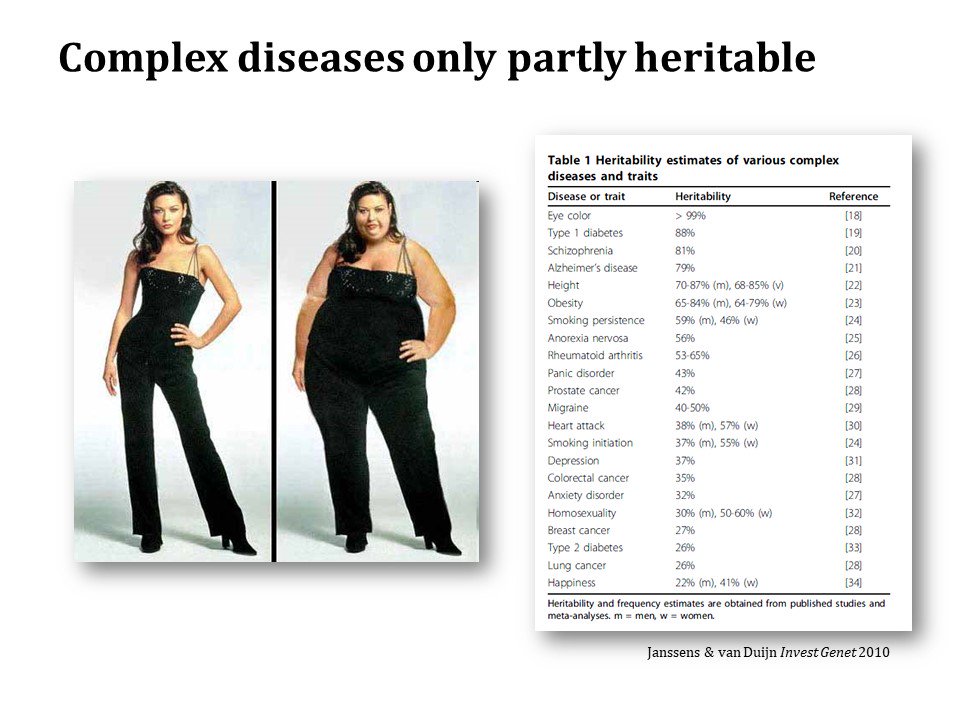
PRS minimally increases c-index when alcohol consumption itself is not used to predict alcohol-related diseases (model 1). If alcohol consumption mediates the association between its PRS and disease, it should be no surprise that PRS doesn't add. Sobering, but obvious.