,
11 tweets,
5 min read
Read on Twitter
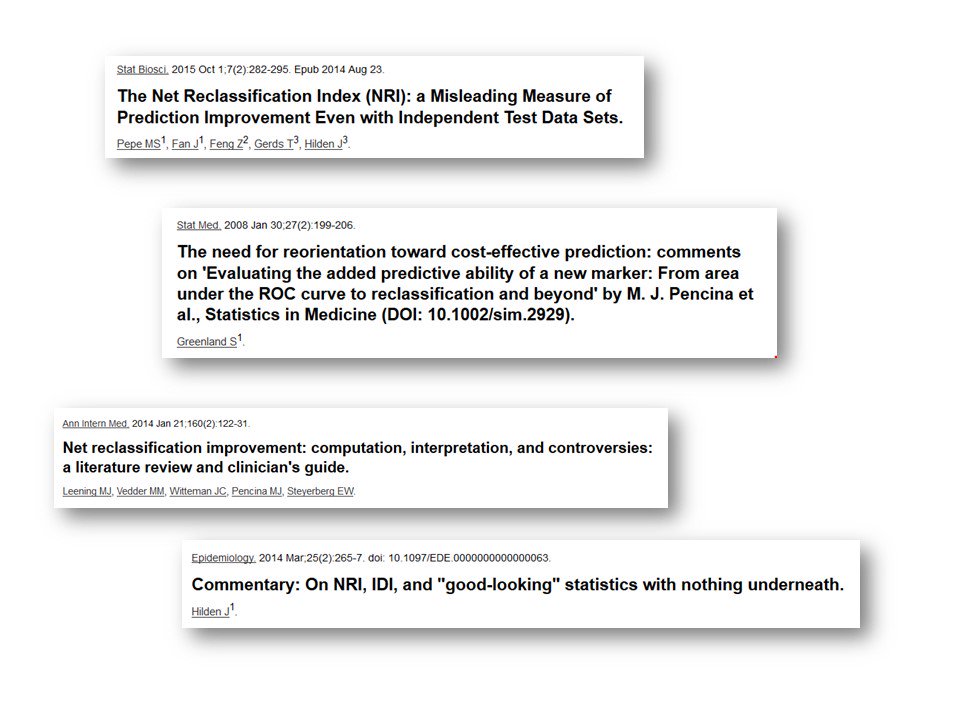
The Net Reclassification Improvement (NRI) is a highly-used metric for assessing the added predictive ability of new markers, even though researchers are often unable to explain what the value of the metric means. This is understandable (except why then do you use NRI?)
(Thread)
(Thread)

It's understandable because NRI is a flawed metric, as many statisticians have already argued. Here's a selection. Many criticisms are quite statistical, not easy to grasp. Let me share a simple shortcoming, one that is best illustrated using apples and oranges.
Here are 6 oranges and 5 apples. In each set, one is rotten. We can calculate the percentage of rotten fruit in each set, but we all know that we cannot add up these percentages as the denominators (what's under the lines) are different.

Back to reclassification. Whether people reclassify between risk categories can be a relevant question but I argue ONLY when a prediction model has established risk categories that come with different interventions. In that case, reclassification affects preventive/clinical care.

Here’s an example illustrating that changes in risks often don't lead to changes between risk categories. It also shows that many people who do move between categories may have small changes in risk that just makes them pass a threshold (red). This happens in both directions.

That is why we are interested in 'correct' reclassification. We want more moves in the right direction than in the wrong direction. That is what NRI aims to measure.

Here I show how NRI is calculated, and how I get from Pencina’s formula to a plain language formula. Nothing new. Just skip.
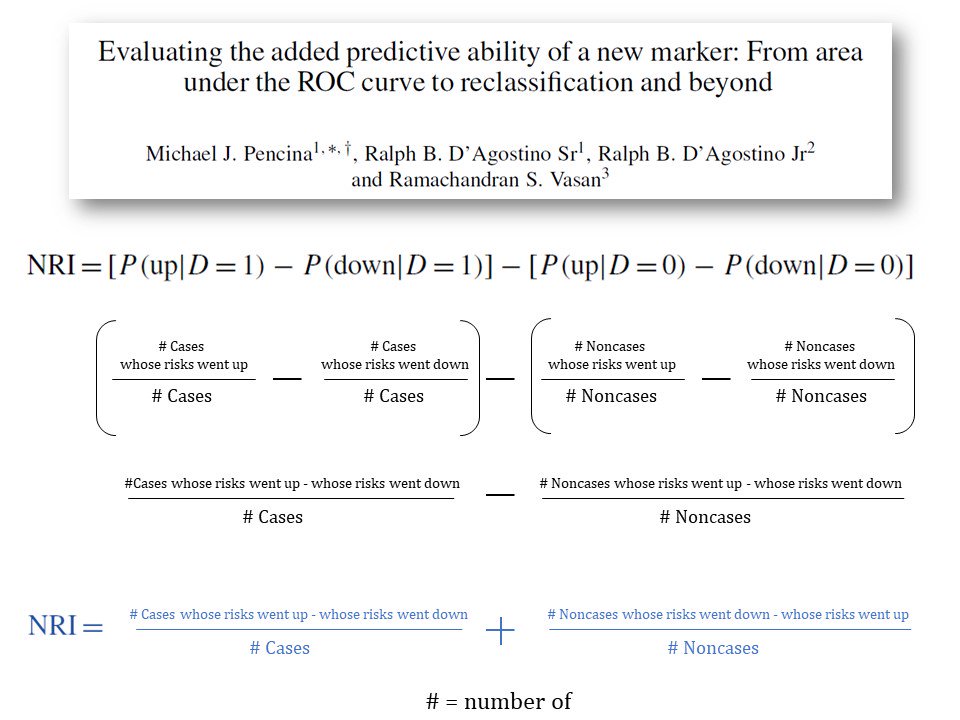
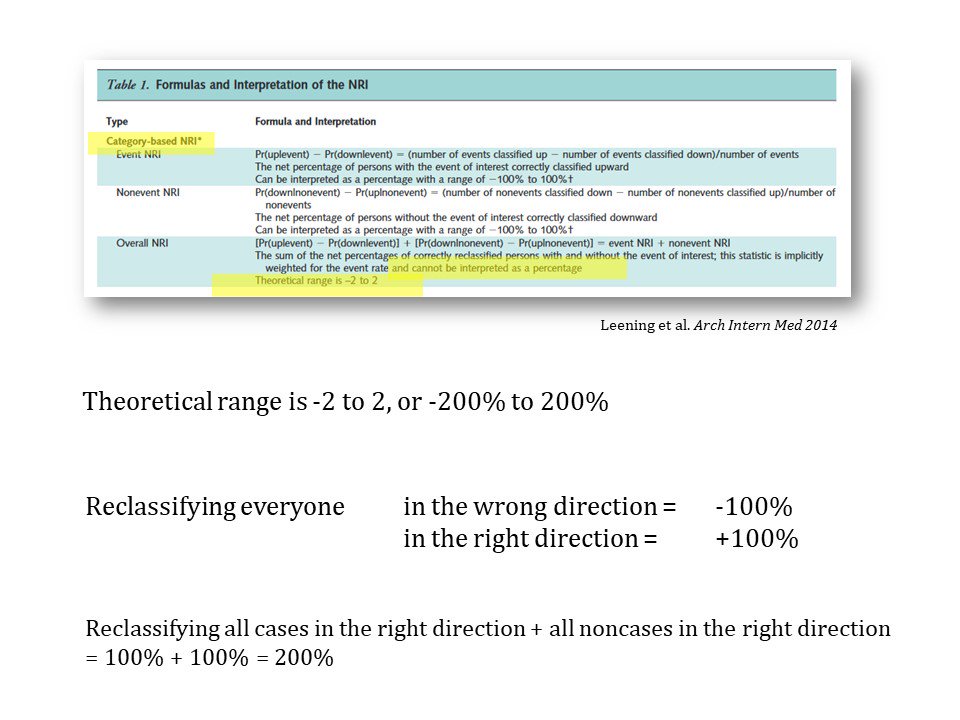
And here is where I compare the plain language formula with the apples and oranges. You see that the formulas are 'the same'? Yes, NRI is adding up (the percentages of) apples and oranges.

The adding of apples and oranges is nothing new. It is why the theoretical range from NRI is -200% to 200%, rather than from -100% to 100%. And it is why the NRI is so hard, if not impossible to explain. The metric just doesn't make sense.
1000s of researchers have eagerly adopted the NRI, imo because the metric often is statistically significant when AUC is not. 'Thus', NRI easily shows improvement in prediction, but is the improvement really there? I am not convinced. At all.

More on NRI and other metrics can be found in our course manual on prediction research (cecilejanssens.org/wp-content/upl…). The slides of this thread can be downloaded here: cecilejanssens.org/slides-from-tw…