
,
27 tweets,
8 min read
Read on Twitter
I'm often asked about Oregon's urban/rural "divide." It deserves attention. Over the next few days, I am going to share some ways that this divide is real, and other ways it is misunderstood. Starting with race today, then age, education, voting. Watch this thread if interested.
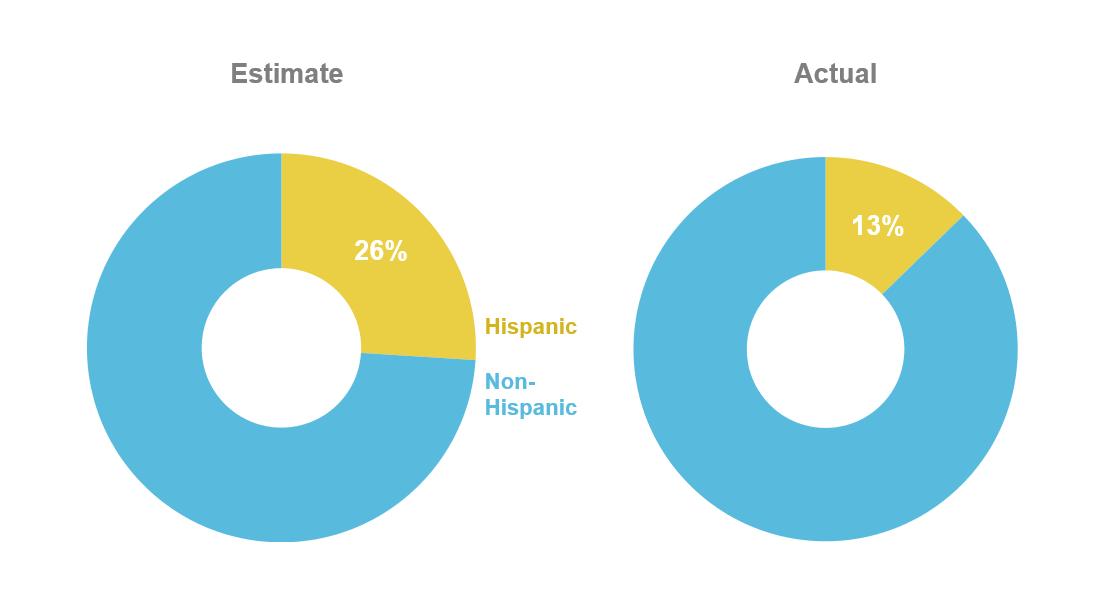
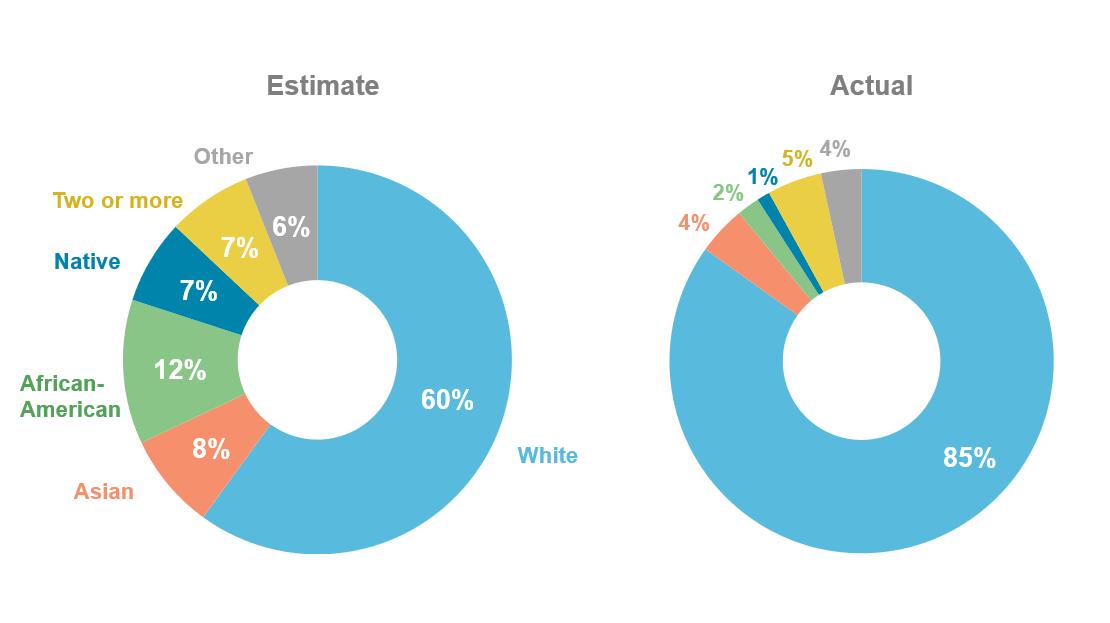
@DHMResearch has asked Oregonians to estimate the percentage of Hispanics and racial groups in the state. They overestimate both.
(This is not uncommon. National surveys show show similar results about this US population.)
(This is not uncommon. National surveys show show similar results about this US population.)
Many Oregonians would probably know that urban counties have the largest # of people of color (Hispanic + non-white), but would be surprised which counties have the highest %. They are rural: Hood River (36%), Malheur (38%), Morrow (39%), and Jefferson (40%).

Here is the growth of communities of color in these rural counties from 2000 to 2017.

In Hood River, Malheur and Morrow counties Hispanics are by far the largest community of color. In Jefferson County it is about split between Hispanic and Native American. Both these groups tend to be much younger than their counties' white population.

(These numbers and percentages from American Community Survey 2017 5-year estimates. If anything, this likely underestimates communities of color, particularly non-citizens and non-English speakers.)
Yesterday, I shared numbers to show parts of rural Oregon are more racially diverse than the state's urban areas. Today some #'s about age. First, perspective.
Median ages:
US - 37.8
OR - 39.2
Oldest county in US, Sumter (FL) - 66.4
Younger county in US, Lexington (VA) - 21.6
Median ages:
US - 37.8
OR - 39.2
Oldest county in US, Sumter (FL) - 66.4
Younger county in US, Lexington (VA) - 21.6
Median ages by county in Oregon range from 32.8 in Benton County to 57.9 in Wheeler County, a difference of 25 years.
Put another way, the typical person in Benton County was born in 1986, while the typical person in Wheeler County was born in 1961.
Put another way, the typical person in Benton County was born in 1986, while the typical person in Wheeler County was born in 1961.

Oregon (and the country) is aging. Here is the increase in median age for the state and a few counties at various points on the age spectrum.
Since 2000, the median age in Curry County has grown by nearly seven years compared to less than 2 in Benton County.
Since 2000, the median age in Curry County has grown by nearly seven years compared to less than 2 in Benton County.

The median age is helpful, but even it can mask challenges the different areas in the state are facing. As an example, here are the % of the population that is less than 18 and over 65.

In Curry County there more more than 2x as many people ages 65+ as under 18. In Morrow County it's the reverse.
Because of their age and diversity, they have profoundly different education, economic, and health care challenges. Yet, they are often lumped together as "rural" and assumed the same.
This repeats itself across Oregon's 36 counties, urban and rural.
This repeats itself across Oregon's 36 counties, urban and rural.
Today education. Let's look at the education attainment of Oregonians. 33% of adults age 25+ have a college degree.
What's often overlooked in these data is that the % of without a high school degree (10%) is nearly the same % as those with a graduate degree (12%).
What's often overlooked in these data is that the % of without a high school degree (10%) is nearly the same % as those with a graduate degree (12%).

The story of education attainment is more straightforward than race and age. College degrees are concentrated in the Portland metro area and a couple other spots, especially Benton County (home of Oregon State University).

There is a huge gap between Benton County (54% with a college degree) versus Morrow County (10%), the county with the lowest percentage of college graduates.
Here is the data that I find most interesting: changes in educational attainment. This chart shows the percentage-point change in 4-year college degrees by county from 2000-2017.

At least a couple things stand out here: 1) There areas of the state that have experience significant growth, especially Multnomah County (31% --> 44%, +13%). 2) There are four counties that have seen a decline college attainment.
Additionally three other counties have seen a decline in college attainment since 2010 (Wheeler, Malheur, Wasco.) All the counties that have experienced an educational decline are rural and on the east side of the state.
But then there is Harney County, which has seen a relatively robust increase of 7-points (12% --> 19%) from 2000 to 2017. Still far behind other parts of the state, but moving in a positive direction. Why? I don't know.
When I travel the state talking to Oregonians about their communities, the evaluate them three ways: 1) objective condition; 2) comparisons to other places; and 3) to the past.
With regards to education, there are areas of the state that are falling farther and farther behind.
With regards to education, there are areas of the state that are falling farther and farther behind.
Today a some data on political affiliation and voting. Tomorrow I'll finish with Oregonians' attitudes related to the urban/rural divide.
First, how are registered voters distributed across the state?
43% Portland metro area (Clackamas, Mulnomah, Washington)
27% Willamette Valley (Benton, Lane, Linn, Marion, Polk, Yamhill)
30% all other areas of the state
43% Portland metro area (Clackamas, Mulnomah, Washington)
27% Willamette Valley (Benton, Lane, Linn, Marion, Polk, Yamhill)
30% all other areas of the state

And the party registration by these same areas.
Democrats have overall edge in the Portland metro area. In the Willamette Valley and the rest of the state, NAV/other voters lead. Though Dems have an advantage over Reps in the WV, and Reps over Dems in the rest of the state.
Democrats have overall edge in the Portland metro area. In the Willamette Valley and the rest of the state, NAV/other voters lead. Though Dems have an advantage over Reps in the WV, and Reps over Dems in the rest of the state.

Here is the vote in the 2016 presidential election. A very obvious urban/rural divide here.
(Only two counties switch from 2012 to 2016. Columbia and Tillamook counties voted for Obama in 2012 and Trump in 2016.)
(Only two counties switch from 2012 to 2016. Columbia and Tillamook counties voted for Obama in 2012 and Trump in 2016.)

Is the urban/rural divide growing when it comes to elections? At the presidential and gubernatorial level, yes it is.
These charts show the % of Democratic vote in presidential and gubernatorial elections across time. It's the PDX metro that is moving more Democratic.
These charts show the % of Democratic vote in presidential and gubernatorial elections across time. It's the PDX metro that is moving more Democratic.


However, the divide is not always as intense. Two examples.
Measure 101 in 2018. A tax increase to fund Medicaid expansion (as part of Obamacare). There were 9 counties that this passed where Trump won.
Measure 101 in 2018. A tax increase to fund Medicaid expansion (as part of Obamacare). There were 9 counties that this passed where Trump won.

Measure 105 in 2018. A measure to end Oregon's sanctuary state status. There were 10 counties that this failed where Trump won.
(Note the Yes and No colors are reserved from the 101 graph. In both, blue represents the "liberal" position and red the "conservative.")
(Note the Yes and No colors are reserved from the 101 graph. In both, blue represents the "liberal" position and red the "conservative.")


