Sumit Verma Profile picture
Dec 3, 2019 5 tweets 3 min read Read on X
#COMEX #GOLD potential Bottom formation.

(view negate below $1450) Image
Naa ye girr raha hai.. naa baddh raha hai.. sirf tadap raha hai..

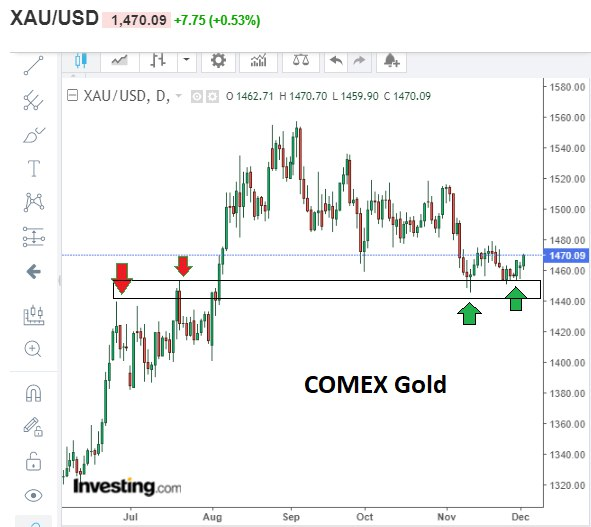
#Bullish view intact in #Gold
SL $1459 Image
#GOLD - finally coming out of consolidation.. Maintain #Bullish view for a new 52 week expectation. SL $1465 Image
#GOLD now $1511.. revise SL $1480.. maintain BULLISH view. (after5 day rally, may see 2-5 day pullback/consolidation but thats ok for a strong trend, momentum likely to catch up in mid-jan probably) Image
Things are happening fast.. #GOLD CMP 1572 now..
Revise SL $1538

Maintain Bullish view. Image

• • •

Missing some Tweet in this thread? You can try to force a refresh
 

Keep Current with Sumit Verma

Sumit Verma Profile picture

Stay in touch and get notified when new unrolls are available from this author!

Read all threads

This Thread may be Removed Anytime!

PDF

Twitter may remove this content at anytime! Save it as PDF for later use!

Try unrolling a thread yourself!

how to unroll video
  1. Follow @ThreadReaderApp to mention us!

  2. From a Twitter thread mention us with a keyword "unroll"
@threadreaderapp unroll

Practice here first or read more on our help page!

More from @sumitverma29

Jun 22, 2020
It is said that Bull Market climbs the wall of worries...

Happening across many markets...

#Copper is one of them too..
Chart Pattern resembles an old one from history

Post 5th breakout higher high, S&P never looked back. ImageImage
Updated chart of #Copper...

Today at 5th Breakout level ImageImage
Update on #Copper...

5th breakout happened...
(Similar to #1987 #S&P500 chart)

Copper Uptrend is Bullish signal for Emerging Markets. ImageImage
Read 12 tweets
Jun 16, 2020
Lesson from recent past.

BALAKOT Airstrike did not trouble market much, I am confident that Indo-China border tussle may not too.

Note: 20 day Average True Range for #NIFTY is 260pts (CMP 9914)

Hence, will maintain 9600 as trigger level to change stance. #NIFTY
Update on #Nifty chart

4th Higher High formation
No weakness in volume to assist divergence
20Day ATR now 250pts (ATR falling means low volatile zone in an Uptrend which is bread butter for Trend Followers)

My view: Bullish as there is no sign of weakness yet.

TREND is UP Image
Update on #Nifty and #Banknifty chart.

I cannot see any sign of weakness externally or internally anywhere.
Prices are rising hence TREND is up.

It is as simple right now.

Current view: Bullish

(Nifty is UP +557pts since Indo-China tussle) Image
Read 52 tweets
May 26, 2020
Today headline Index was weak but breadth was pretty good both on price as well as volume side. #Nifty Image
Breadth do speak.. we just need to hear them well.. #Nifty Image
Breadth... Breadth... Breadth... most important momentum tool for me.. always.. #NIFTY Image
Read 5 tweets
May 23, 2020
#LetsLearn

Earlier I explained how to make charts cleaner by using Two day Swing Lines & today I explained how to identify Relative Highs & Relative Lows in an objective manner
Link1:

Link2:

1/n
#LetsLearn

Now I will try to show how to make a TRADING system out of the two....

Tools used:
Relative High AND Low identifier (N=10) and
Two day Swing Lines

.....2/n
#LetsLearn

Further to the above thread to find trade setups using the above mentioned tools.

Topic: Identifying "TREND FOLLOWING trade setups" using Top-Down approach

- Weekly and Daily charts are taken with Relative Highs and Relative Lows marked (parameter N=5)

..contd..
Read 7 tweets
May 23, 2020
A thread on how to Define correct Swing Highs / Lows for the purpose of Dow Theory analysis or drawing Trendlines:

Thomas DeMark in his book "The New Science of Technical Analysis" said that drawing
of trend lines is a highly arbitrary process. 1/n
A trend line is typically intended to connect
several Relative Highs or Relative lows. If there are two or more such points, the trend line can be drawn
precisely. (notes from Jack Schwager's book "The Complete Guide to the Futures Market").. 2/n
Relative high is a High that is higher than high on the N prior & N succeeding bars.
where N is a number of bars (can be anything as per individual's setup 5 / 10 / 20...)

if N = 5, Relative High is Current High > last 5 days & succeeding 5 days. Viceversa for Relative Low.. 3/n
Read 10 tweets
May 17, 2020
Further to my initiative of #LetsLearn where my objective is to de-code complex things & make things simple and available for analysis...
Today, I will try to make a complex looking chart into a clean & simple one (only useful for people who are PATTERN based trader/analyst)..1/n
amazon.in/Pring-Price-Pa…

Further as disclaimer, the presented way will be more useful for people who have followed Martin Pring's book on chart patterns.. (images taken from Kindle version of the book)
The below are Candlestick charts of #NIFTY50.. a lot of times market moves inside a range throwing multiple Bullish/Bearish candlestick patterns and adds up the clutter in analysis (Pro Candlestick / Bar / short term traders wont have a problem) but for others it is a confusion..
Read 12 tweets

Did Thread Reader help you today?

Support us! We are indie developers!


This site is made by just two indie developers on a laptop doing marketing, support and development! Read more about the story.

Become a Premium Member ($3/month or $30/year) and get exclusive features!

Become Premium

Don't want to be a Premium member but still want to support us?

Make a small donation by buying us coffee ($5) or help with server cost ($10)

Donate via Paypal

Or Donate anonymously using crypto!

Ethereum

0xfe58350B80634f60Fa6Dc149a72b4DFbc17D341E copy

Bitcoin

3ATGMxNzCUFzxpMCHL5sWSt4DVtS8UqXpi copy

Thank you for your support!

Follow Us!

:(