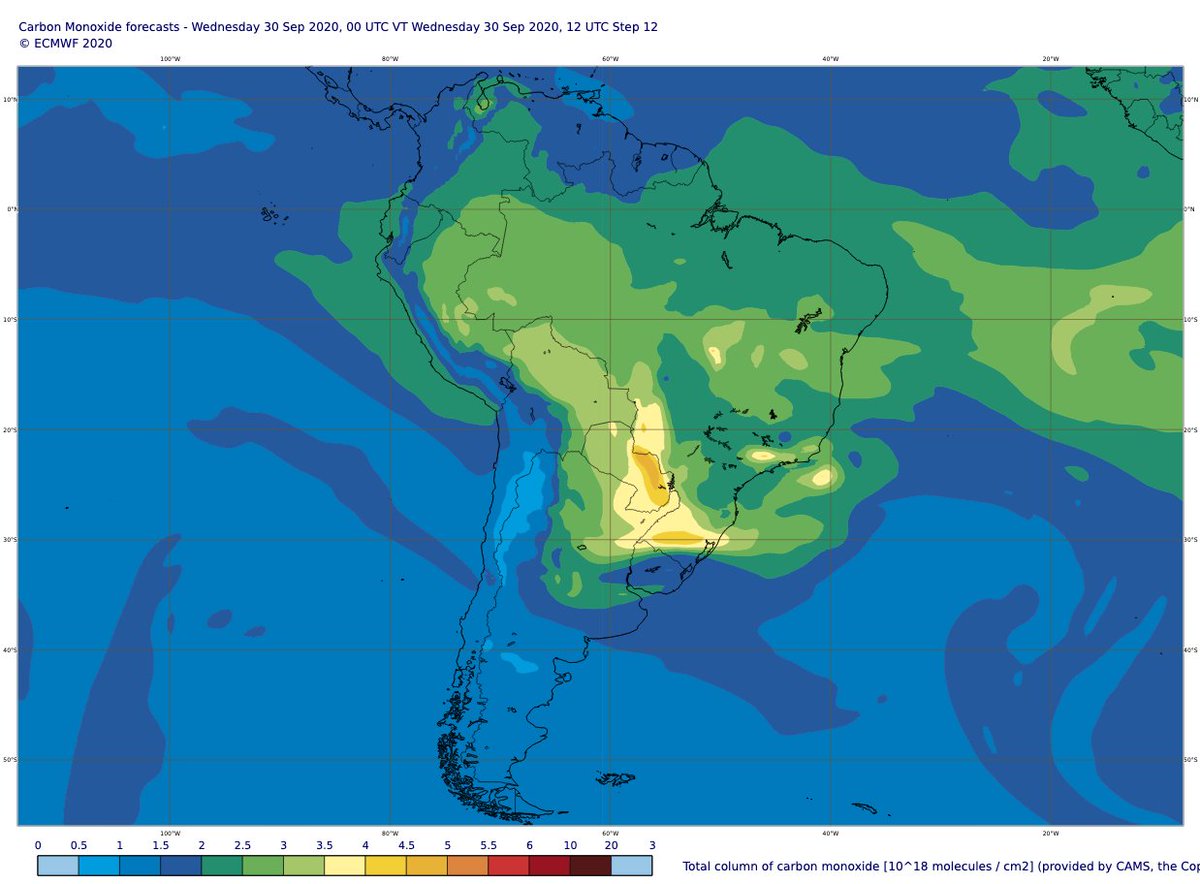
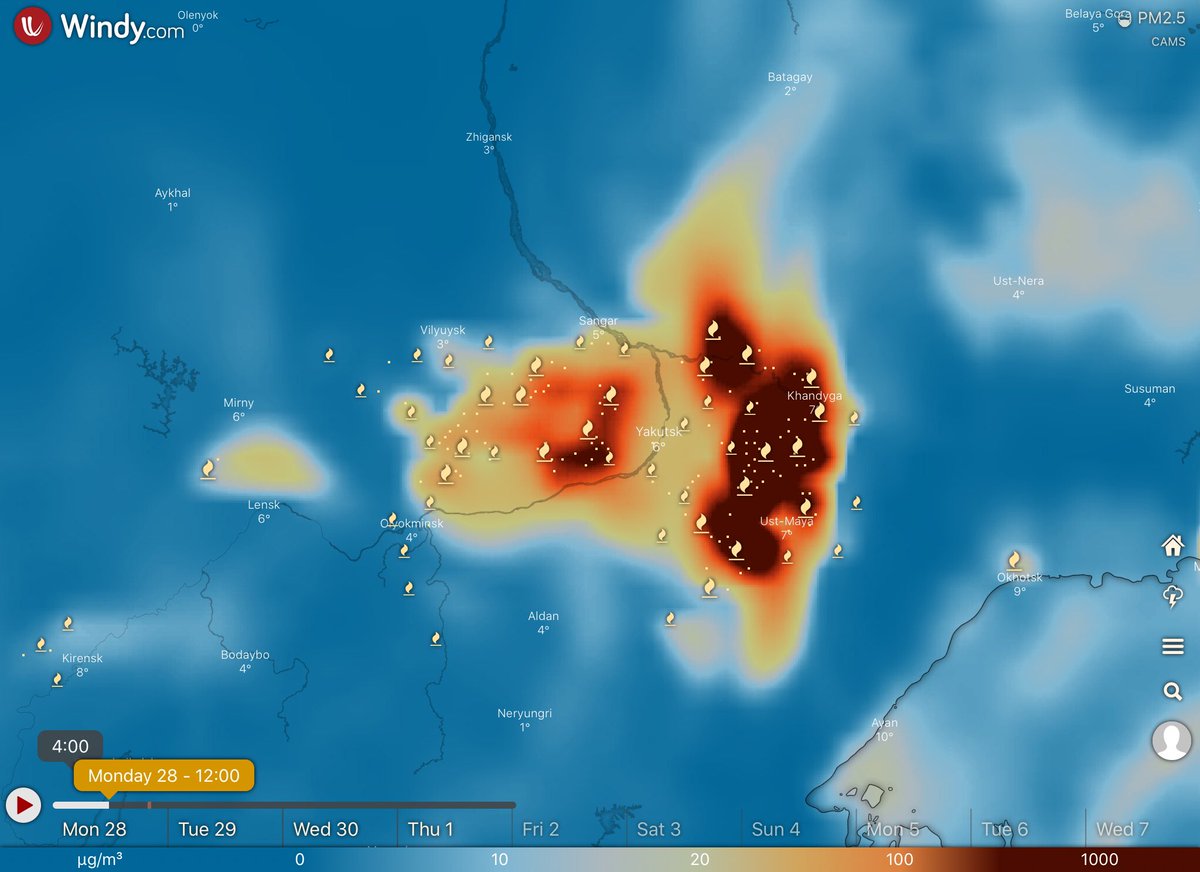
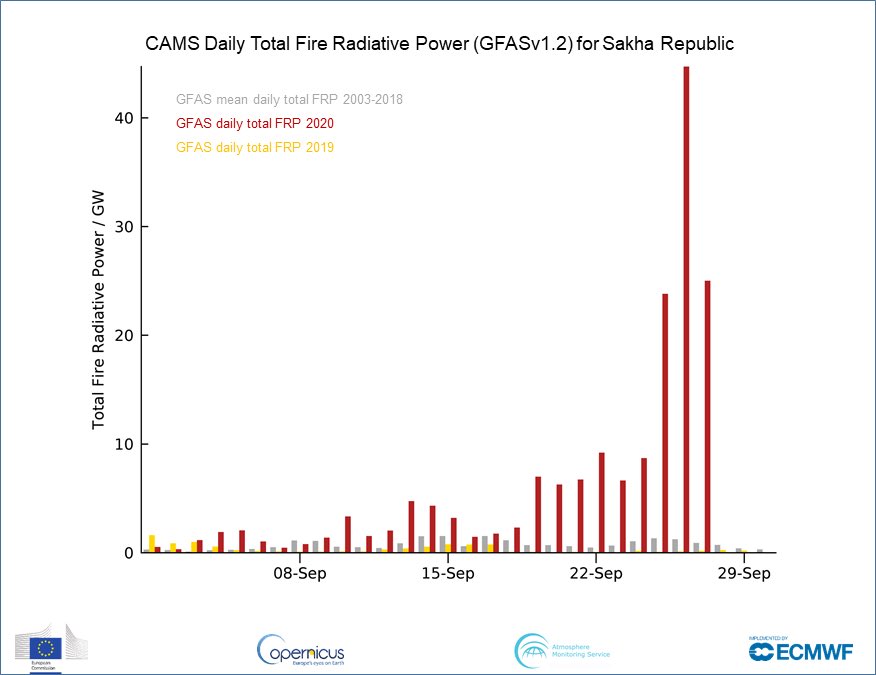
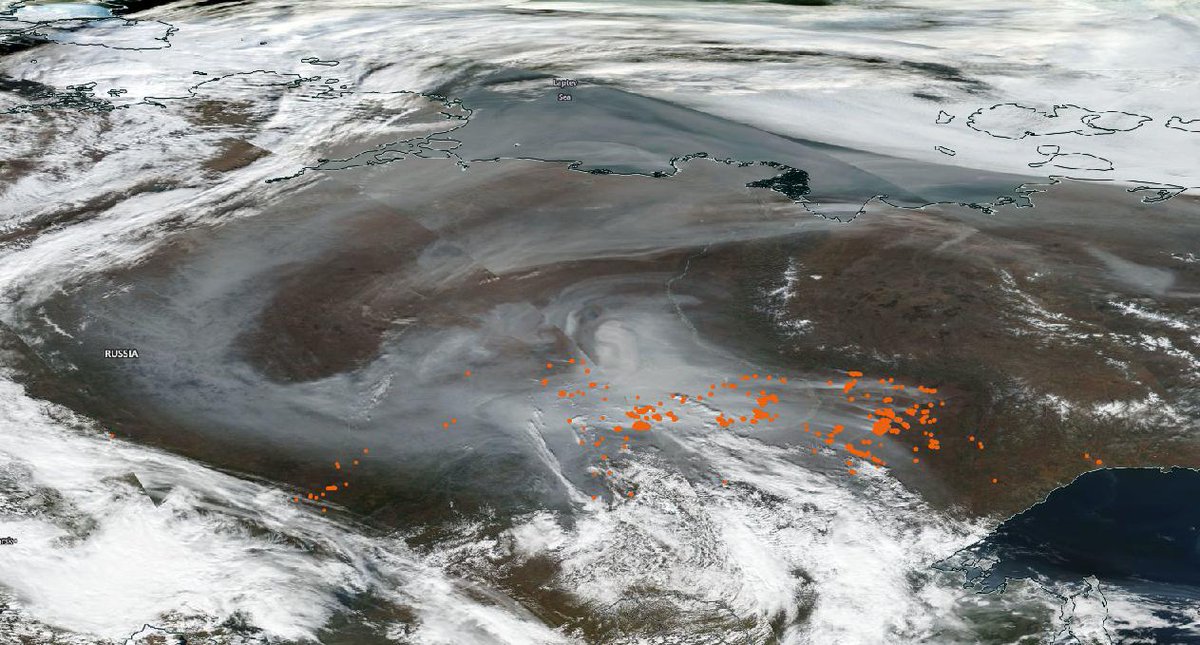
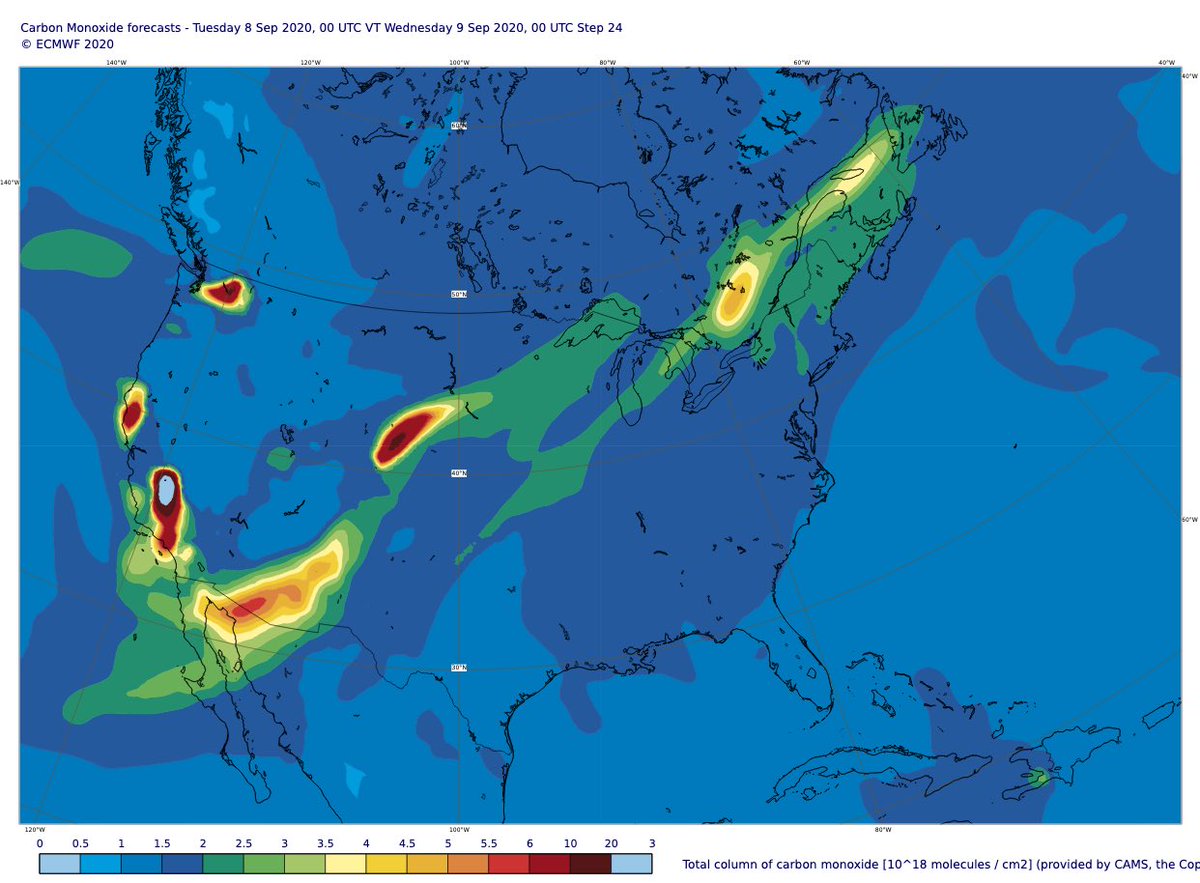
Clear increase in daily total intensity of #CaliforniaFires & #ColoradoFires on 7 Sept >> 2003-2019 mean in #CopernicusAtmosphere GFAS data. Latest 24-hour aerosol & carbon monoxide forecasts show long-range transport of smoke extending across the US from SW to NE. 


Aerosol forecast charts ➡️ atmosphere.copernicus.eu/charts/cams/ae…
Carbon monoxide forecast charts ➡️ atmosphere.copernicus.eu/charts/cams/ca…
Carbon monoxide forecast charts ➡️ atmosphere.copernicus.eu/charts/cams/ca…
Incredible scale of ongoing #CaliforniaFires with total estimated #wildfire emissions for California to 7 Sept 2020 already state’s highest annual total in 18-year #CopernicusAtmosphere GFAS dataset (Colorado achieved this in August) confluence.ecmwf.int/display/CKB/CA… #CAfire #COfire 


@Pierre_Markuse @RSFireNerd @cwiedinm @pyrogeog @bobyokelson @mikeflannigan @DrBalch @NickyNaus @jmccarty_geo @SanGasso @wildfiretoday @IAWF @NCAR_ACOM @CIRA_CSU @CIMSS_Satellite @Weather_West @DanLindsey77 @wildfirecenter @RobMayeda @Rafacereceda @alexwitze @themadstone
cc @OroraTech @mayday_ai @VHPeuch @RichardJEngelen @AntjeInness @Mel_Ades @henk_eskes @kkno21 @ryans_wx @WMO @GuillermoRein @DrTELS @TheRealPyroTina @ESA_EO @eumetsat @Atmospheric_SAF @tonyveco @robertdfield @fdg10371 @clavitolo
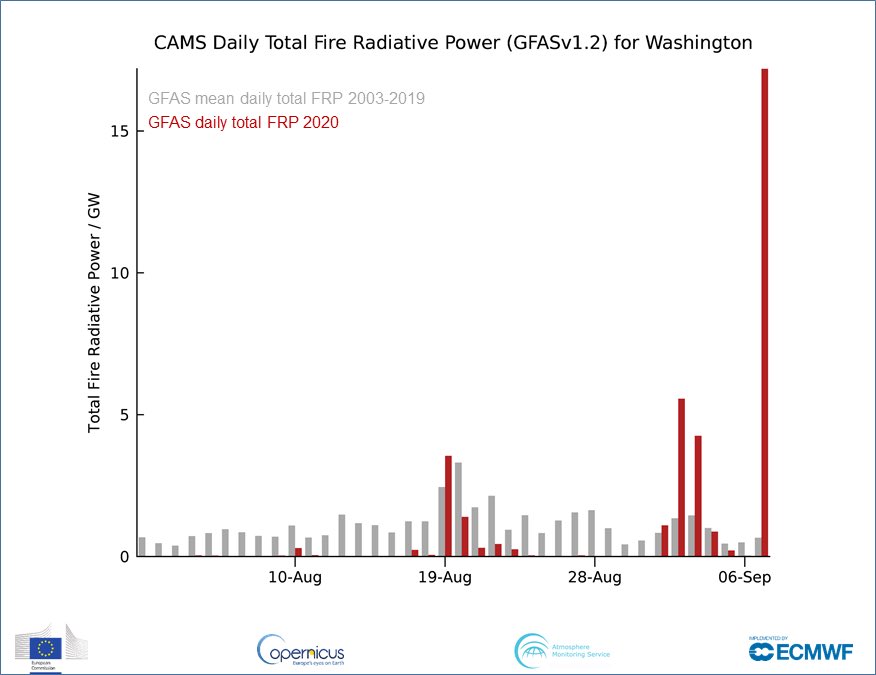
Other states also experiencing significant #wildfires such as this sudden increase in daily total intensity for Washington #WAfire #WAfires @waDNR @waDNR_fire 
• • •
Missing some Tweet in this thread? You can try to
force a refresh


