
Senior scientist Copernicus Atmosphere Monitoring Service @CopernicusECMWF @ECMWF working on global #wildfires #airquality #atmoschem & #scicomm
 Noting sharpest recent increase in NWT in the last couple of days but still with quite some way to go to catch 2014 and 2023.

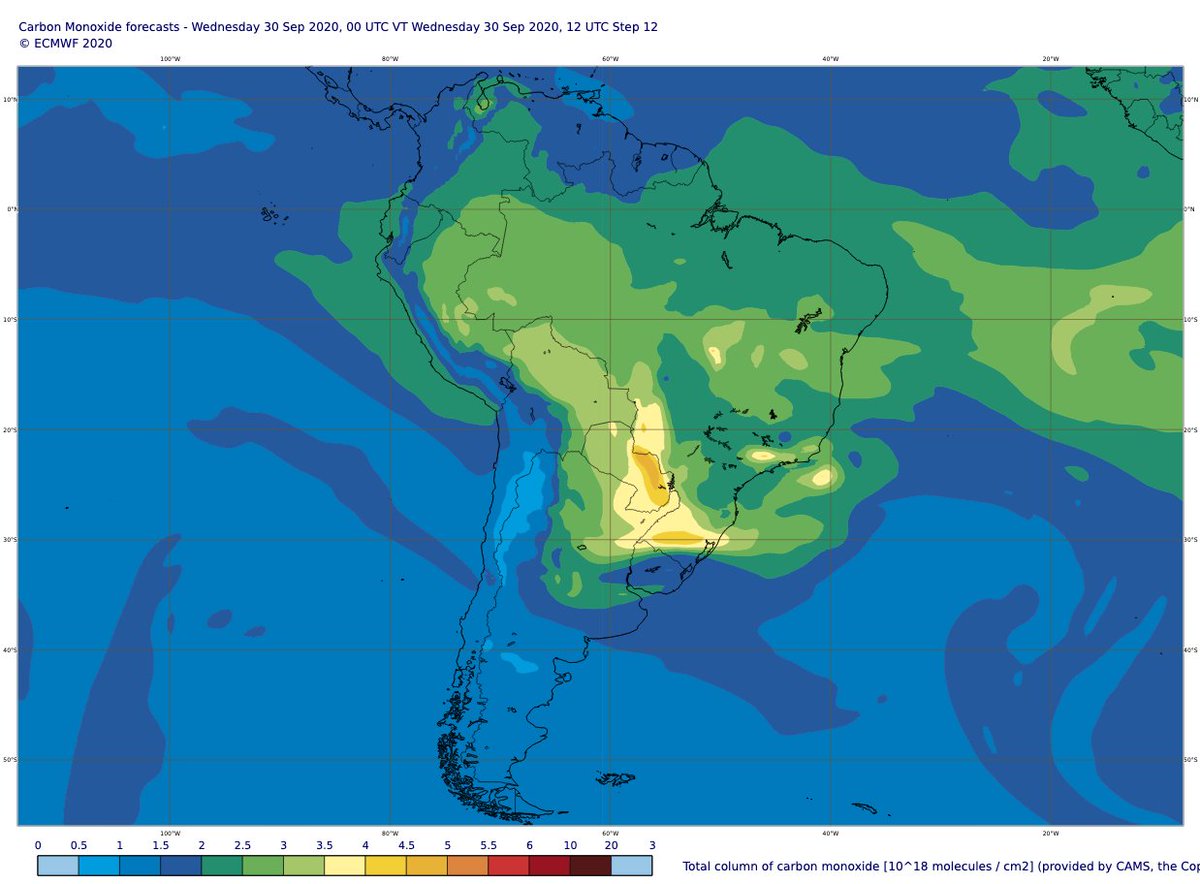
 #CopernicusAtmosphere GFAS #opendata for Amazonia Legal & Mato Gross do Sul🇧🇷 showing daily total intensity since 1 August & estimated carbon emissions since 1 July. Generally similar to 2019 Pantanal fires increasing MGS data in recent days.
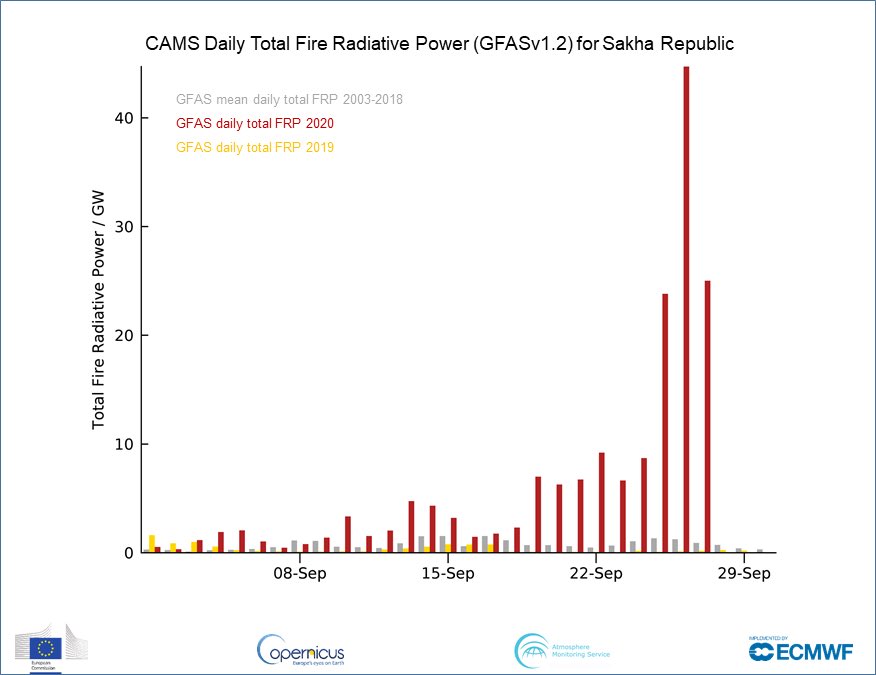
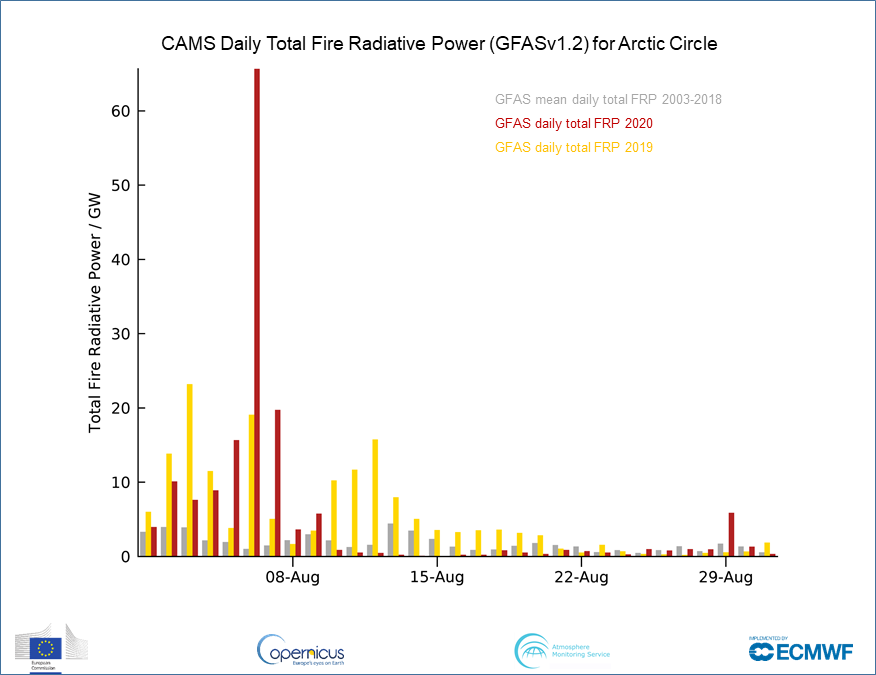
 For context, current daily total intensity of #Yakutia #wildfires compared to the rest of the season from 1 June


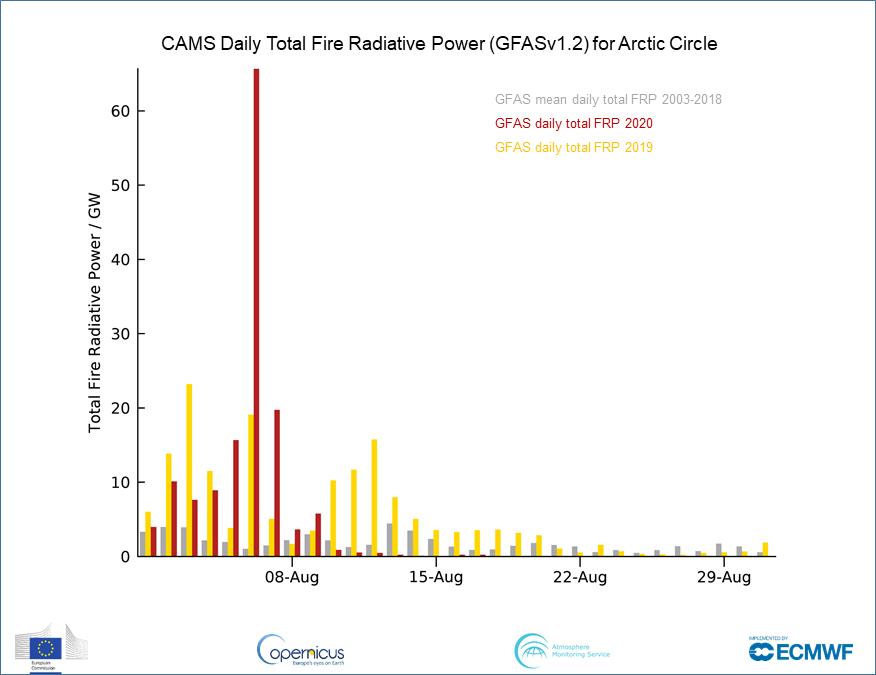
 More info on Global Fire Assimilation System (GFAS)➡️ confluence.ecmwf.int/display/CKB/CA…

 @JChimotScience @tonyveco @annamaria_84 @GuillermoRein @centrewildfires @sgconard @queenofpeat @cwiedinm @GuidovanderWerf @robertdfield @TheRealPyroTina @dr_firelady @RSFireNerd @OroraTech @steverarnold @ACRoBEARArctic @_Arctic_Circle @WeatherSarov1 @AarneGranlund


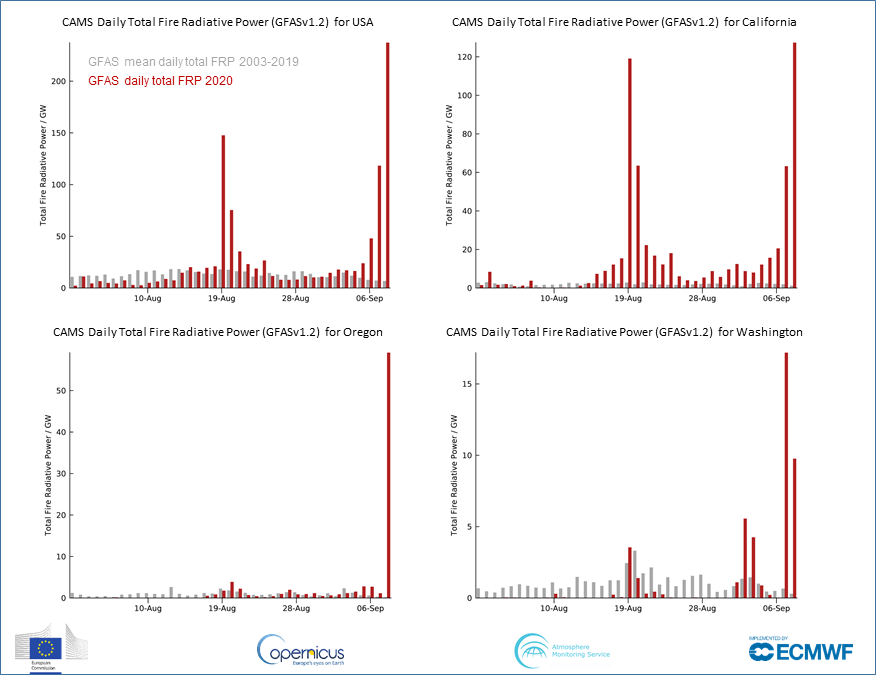
 @CAL_FIRE @ODF_COD @NWCCInfo @waDNR_fire @wildfiretoday @IAWF @wildfirecenter @pyrogeog @DrBalch @gollnerfire @bobyokelson @jmccarty_geo @cwiedinm @TheRealPyroTina @NickyNaus @Weather_West @CIMSS_Satellite @OroraTech @mayday_ai @Pierre_Markuse @tonyveco @annamaria_84


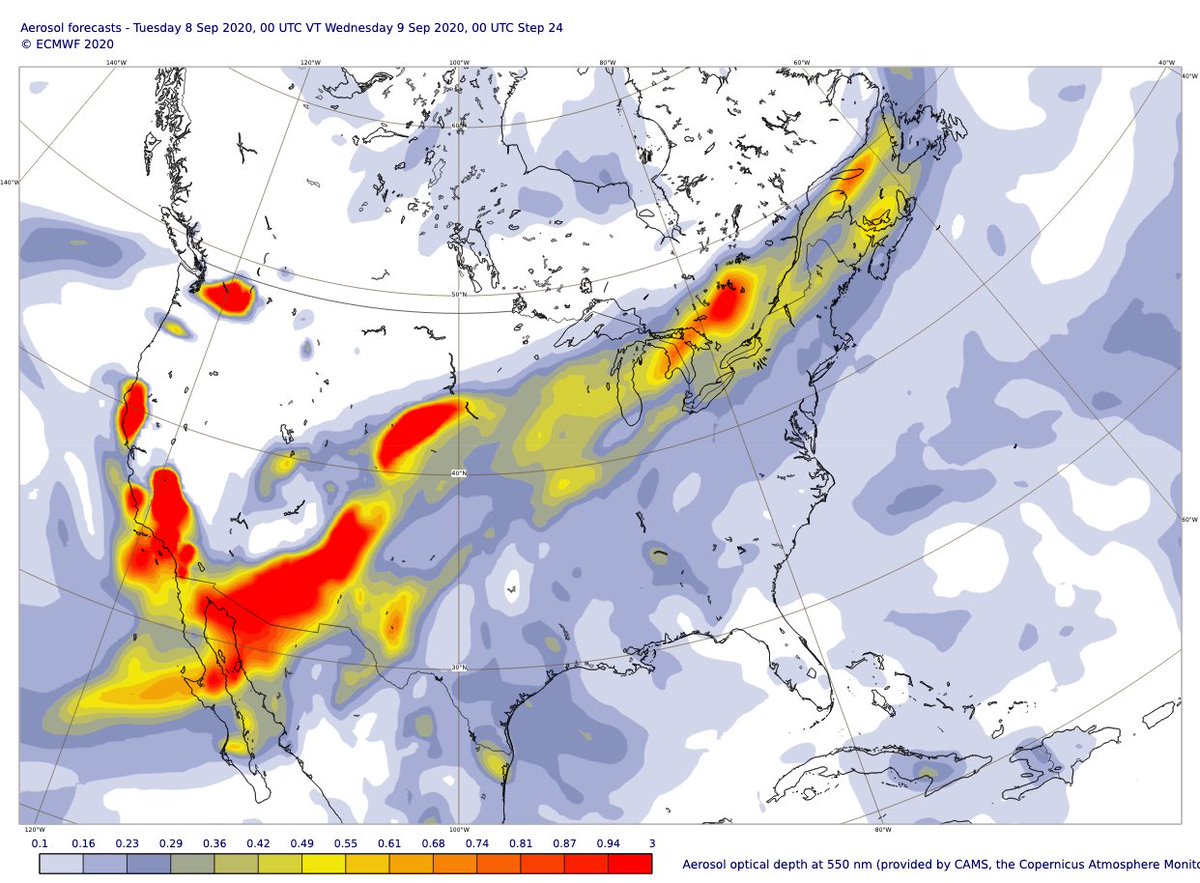
 Aerosol forecast charts ➡️ atmosphere.copernicus.eu/charts/cams/ae…
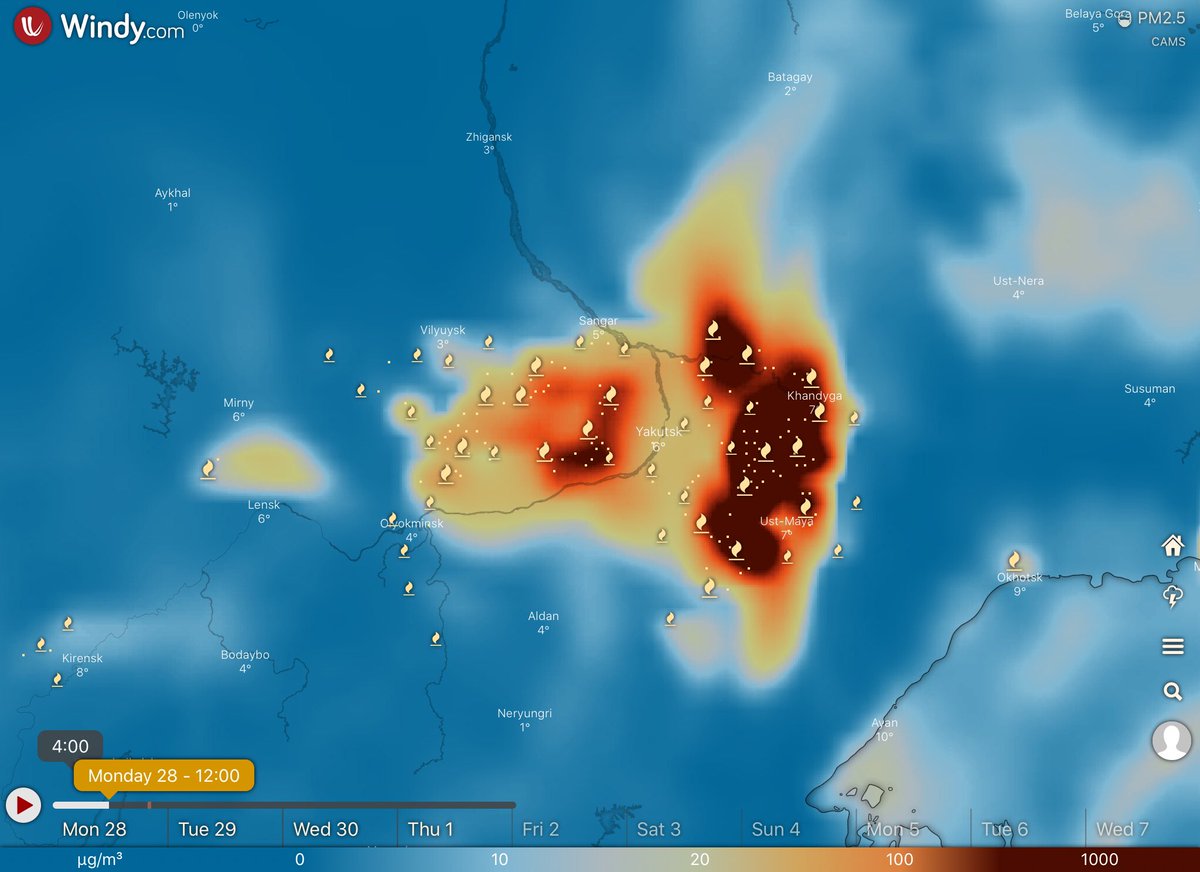
 PM2.5 forecast ➡️ windy.com/-PM2-5-pm2p5?c…

 @VHPeuch @RichardJEngelen @AntjeInness @Mel_Ades @henk_eskes @JChimotScience
 #Wildfire activity in other parts of #Siberia has been relatively low all summer. Krasnoyarsk & Irkustk have been experiencing increased daily total intensity over last 2 weeks close to 2003-2018 mean & << 2019.


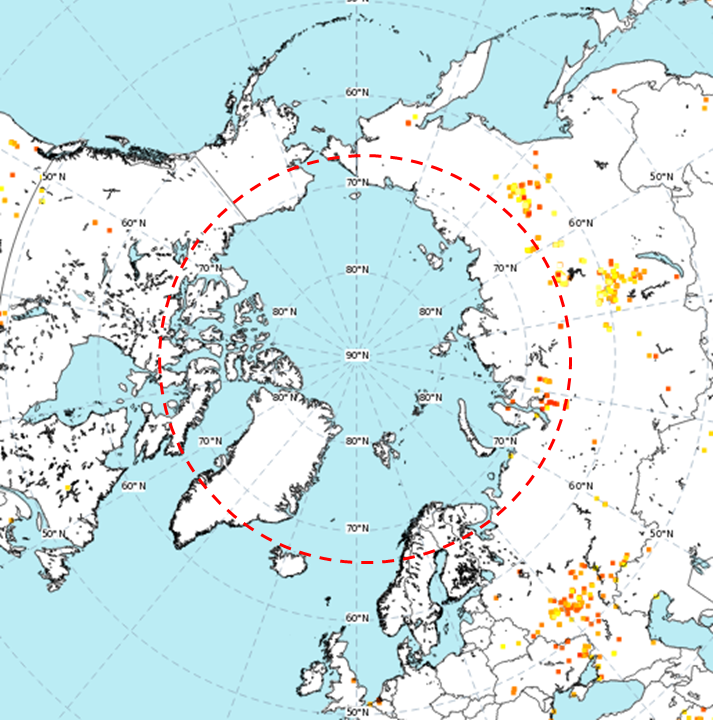
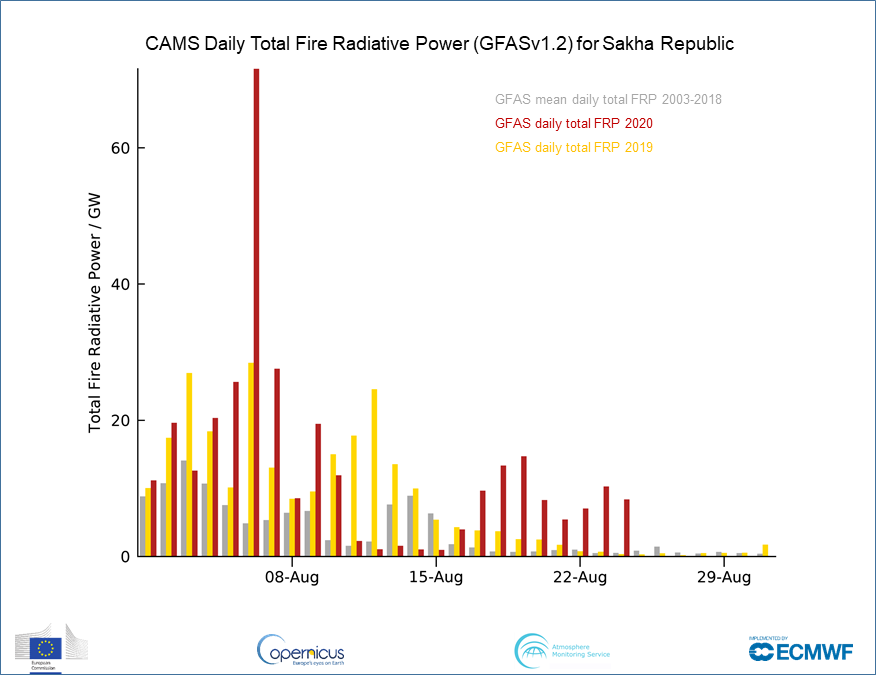
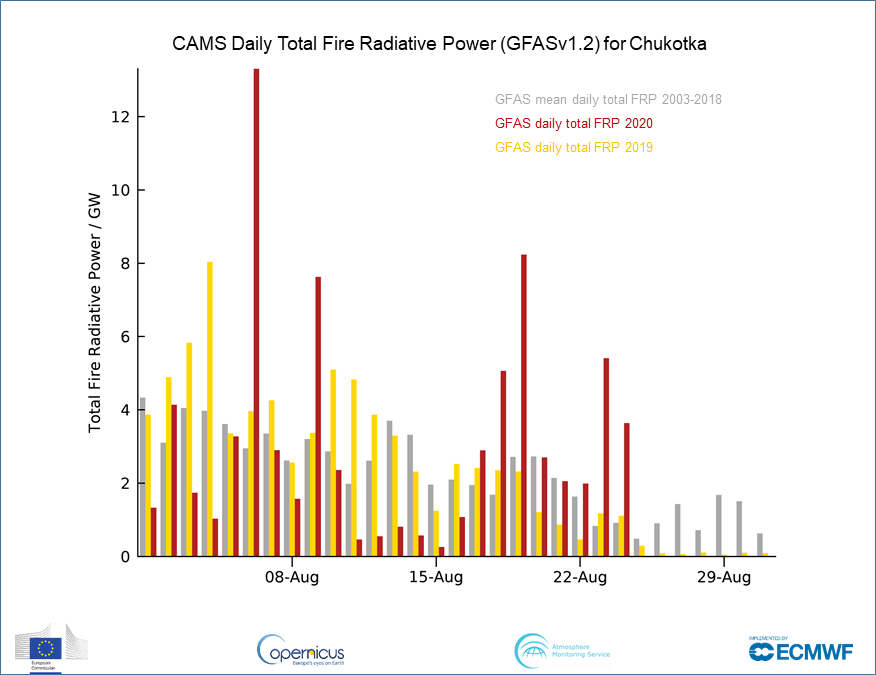
 Daily total #Siberia #wildfire intensity for Sakha Republic &Chukotka Autonomous Oblast showing some increase at or slightly > 2003-2018 mean in recent days but << the activity earlier in August


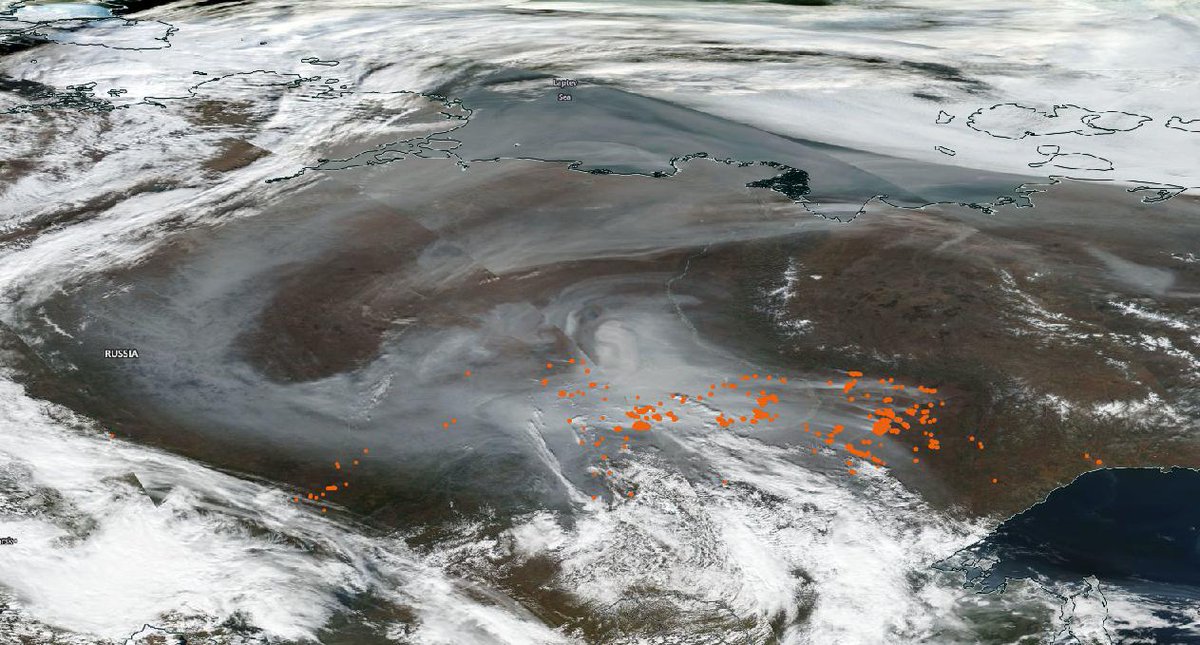
 Global Fire Assimilation System (GFAS) data from the Copernicus Atmosphere Monitoring Service atmosphere.copernicus.eu