16 October 2020 #BetweenTheLinesDotVote Analysis
If Only I Could Believe The Data...
I'm a data addict. I can't help myself. It calms my disturbed and troubled mind. And, if it's only rational, then I'm happy. No, not by the results forecasted, just merely be the rationality.
If Only I Could Believe The Data...
I'm a data addict. I can't help myself. It calms my disturbed and troubled mind. And, if it's only rational, then I'm happy. No, not by the results forecasted, just merely be the rationality.

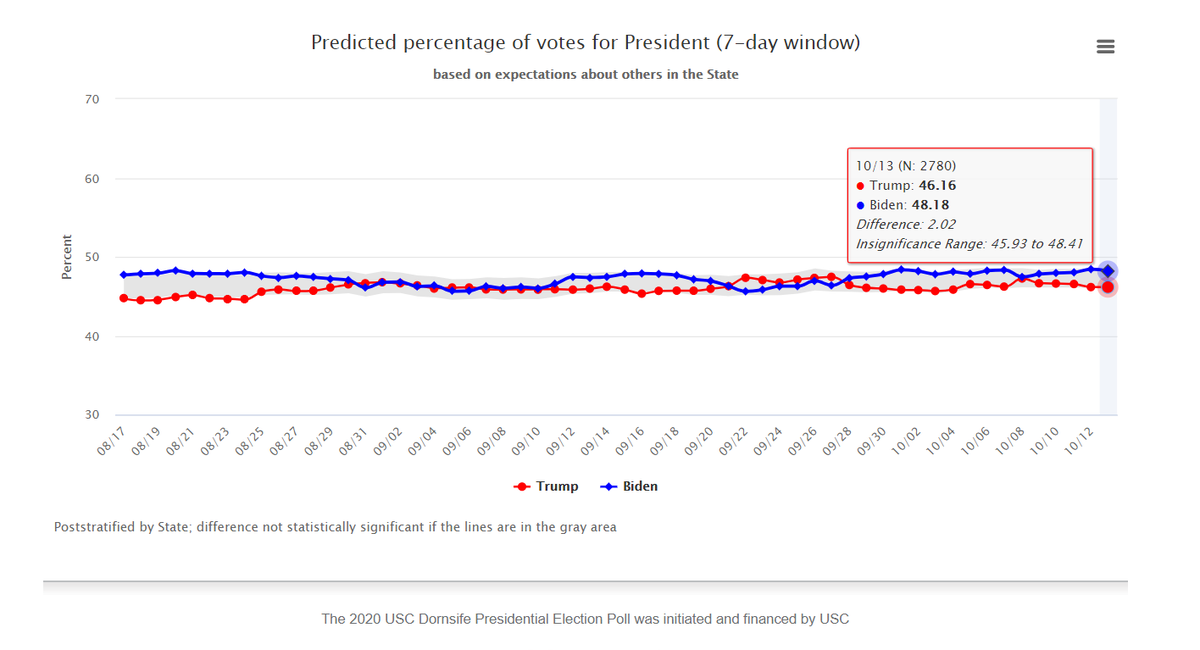
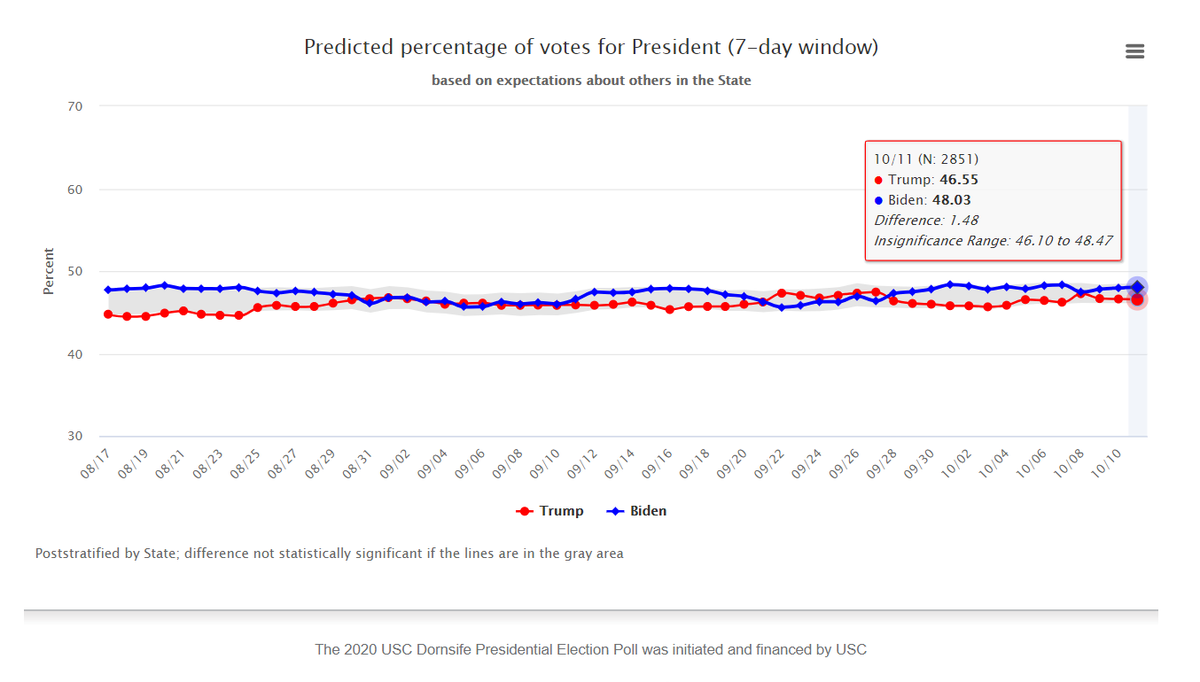
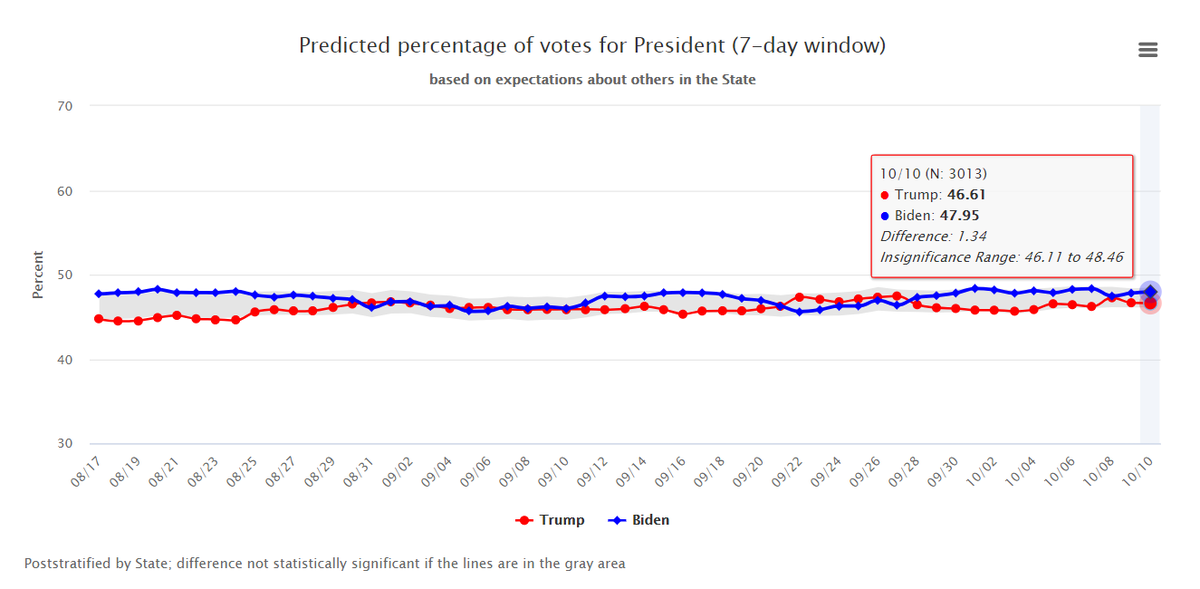
2) The first point to be made, and repeated, is that every bit of this data falls within the margin of error area. By this ONE chart, the election has been a statistical dead heat from day one. I respect that. Every other chart Dornsife offers has Biden a 100% winner. Locked.
3) I add happily that I have never believed these numbers. I have only allowed them closest to the truth status, out of all the other blather Dornsife posts. My real belief is that Trump has been ahead of Biden this entire time. I am, however, humble enough to consider this data.
4) So here we go. This is the only chart I'll share today for Trump's data. It's a great chart. I'm happy with it...as such. I believe this chart would accurately reflect where Trump really is if it was, oh, about 3 or 4 percentage points higher. Still, it's a good chart. 
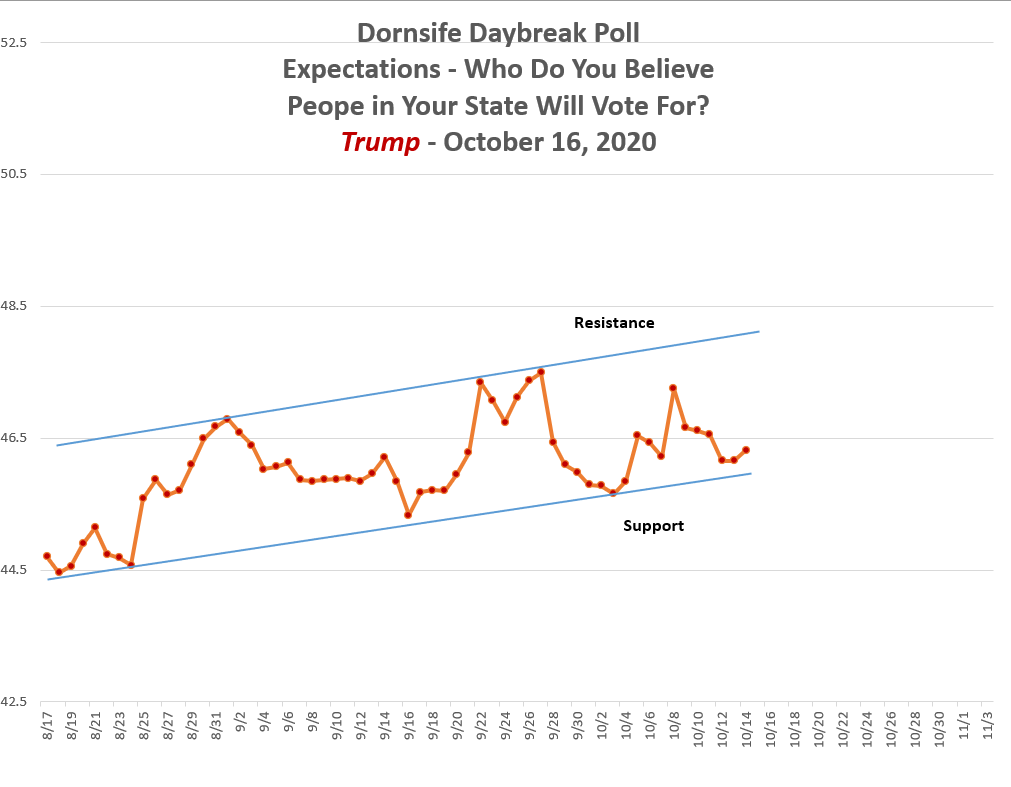
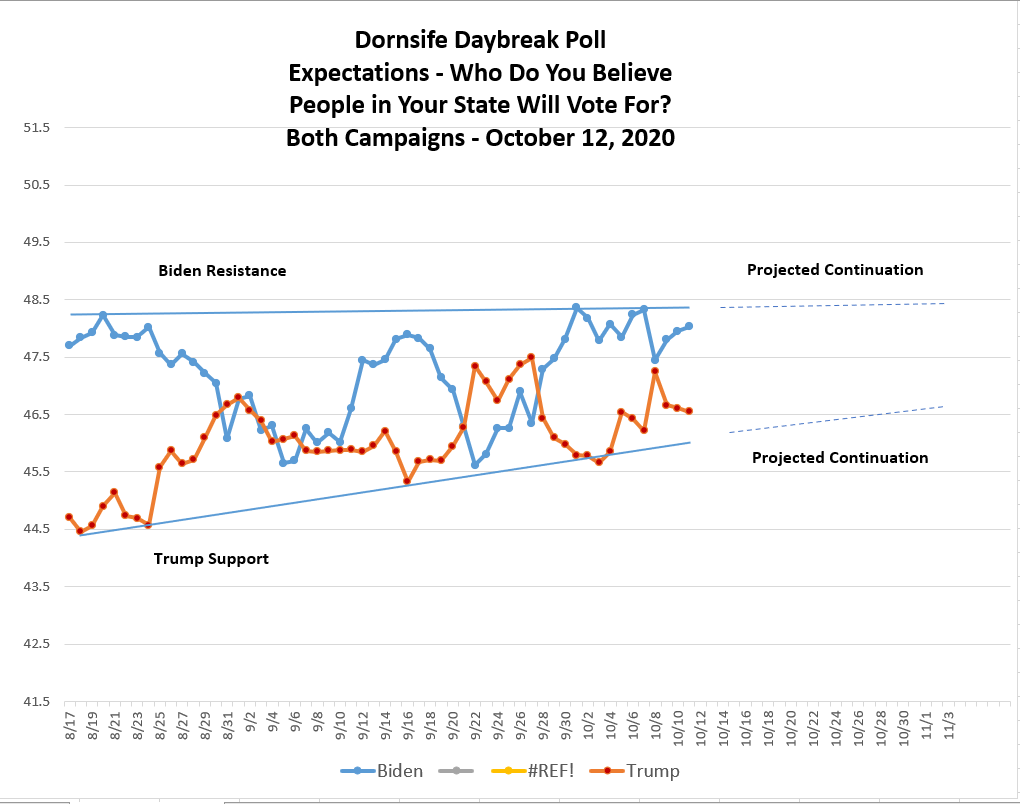
5) What's it mean? First, it means that Trump support is strong. Really strong. Second, that damned resistance line is real. He's got to break it, and this late in the election, that's NOT an easy thing to do. How can it happen? Ha! I'll answer that question!
6) If I'm a Trump advisor, I have ONLY 1 message. Joe Biden is a criminal. He defines the corruption of the DC Swamp. He is rich beyond the dreams of avarice. His entire life has been in politics, he's never had another job. How is he rich? How? Corruption is the answer.
7) Do the math. 47 years a politician. One of the richest men in the state of Delaware. How does that happen? It happens through the sale of your position. First as a Senator. Second, and oh ho, how wonderful for your pocketbook, as Vice President. R.I.C.H. He's rich.
8) If I were managing the Trump campaign, I'd have an entire team, with virtually unlimited resources, answering the following question: How rich is Joe Biden? And how did he become that rich? I'd have stories hitting by the hour.
9) We have charts to turn to. They're interesting. I almost wish they weren't. Yet, well, let's get going. My own first chart today is just Trump's. I say just because I'm only going to give you one. Every other chart I'll give you two. Just follow along... 

10) If I believed this chart was true - I don't, I believe Trump is WAY ahead of Biden - I'd be saying, Dude, why are you hanging around down by support? if you're going to win, you have to hit and break through resistance? Come on, if we don't make our move now...
11) The obsessive chartist in me has a different point to make. When a channel is this true, then well, it might be true. Angle of ascent is fine, if we have unlimited time. But, by deadline, well, we're NOT looking good. It's just not strong enough.
12) So then, while we're on the bad news side, look at this terrible, hellacious, evilly bad chart. I detest this chart. It essentially calls for Biden. And remember, this chart is the best one Dornsife offers us. Well, along with my lines and analysis... 

13) If this chart is right, meaning, if this data is true, Biden is just about to put Trump into the dust. Not quite certain yet but almost there. For those who've been following along Biden's resistance has risen. For us Trump people, very bad. For our Democratic friends, GREAT!
14) We have more charts to work on, and we will. Beforehand though, there's this. What if Joe Biden isn't merely a criminal, what if the current story about his son and Burisma, etc., is verified? What if we can nail down Biden's path to wealth?
15) There's that damned resistance line holding steady and strong at just over 48%, never yet broken. I keep saying, Trump is the most dangerous politician in the world to underestimate. Besides, as I keep emphasizing, Dornsife may be tricking this data.
16) Before moving on, I must share that I've raised Biden's resistance line, and that pushes the crossover point all the way out to the very day of the election. If these numbers are true, and if Biden finally breaks his resistance line, then he's won.
17) Looking at this one chart, if I believed it, I'd have to give Biden at least a 90% edge over Trump. Surprisingly, even if I supported Biden, that's not enough to make the call. To make the call for Biden, if I believed this data, He'd have to break out above resistance.
18) Even if we believed this data, we're still talking about a 1.65% difference, well within the margin of error. Truth is, this means we just don't know, yet.
19) We have two charts to consider for Biden. Here's the first. I don't remember what day I first drew his possible Victory Path. I have not, however, changed it from then till now. Look where he's at. The line holds, for now. If he falls tomorrow it breaks. If he rises it holds. 

20) It's important to remember that as long as Biden plays with his resistance line, and Trump plays with his support line, Biden wins. It's obviously called playing out the clock.
21) Speak of which, check out Biden's second chart from today! I have not changed the hypothetical line since I first drew it. As Biden plays out against his resistance line, and ventures into victory channel, he looks to win. 

22) Charts are charts. The data? Who knows? This chart represents the biggest of the big picture trends to date. According to Dornsife, Biden's victory has been written in the winds since day 1.
23) Our final chart for today is another view of Biden vs Trump. Again, please remember, it's very possible we might invert Biden's lead over Trump, and have Trump FAR in front, if we had credible data. 

24) Still, taking this chart as if it were accurate, you can see the Biden can run out the clock at his resistance. And, that as long as Trump only plays around his support, we end up with a Biden victory.
25) Now, let's talk about fundamentals. Is Biden actually a crook? Did he take millions for his role in politics? did he become a millionaire on the basis of his political position? And, can the come out, as in honestly, really come out, in the remaining days?
26) And how corrupted is this data? That is, imagine that Biden were to tank due to his corruption story. Would it show up here? Or, would it be glossed over by data corruption? I wish I knew. I wish I could believe my own eyes, my own lines.
27) So, once again, the answer is we don't know.
Yesterday, I called for Trump. I stand behind the call, but no, I do not have the data to base it upon. I hate that more than you can imagine. I feel like I'm a scientist asking for a miracle.
Yesterday, I called for Trump. I stand behind the call, but no, I do not have the data to base it upon. I hate that more than you can imagine. I feel like I'm a scientist asking for a miracle.
28) We have the days. No, not many, but enough. My hope, for better or worse, is that Dornsife's numbers end up calling the election rightly. If Biden wins, I'll eat my sad crow. They'll have called it from day 1.
29) But I'm still saying, fundamentally speaking, Biden's crimes in office should completely disqualify him. I don't believe Hunter Biden became a multimillionaire without his father's corruption as its basis. I don't think we should reward that.
30) And, oh joy! Twitter had to change its stand on this story? Hey, let me go get that link! Here it is!!!
Please enjoy!
nypost.com/2020/10/14/ema…
Please enjoy!
nypost.com/2020/10/14/ema…
Thread ends at #30.
• • •
Missing some Tweet in this thread? You can try to
force a refresh


