This is not as stringent a lockdown as before - children are still at school (which has benefits for the children), and people are less apprehensive than the first lockdown.
The lockdown was announced in advance, and we have seen people go to shops yesterday in great numbers to ensure they have the products they want.
And yesterday was seen by some as the last chance for a gathering.
Both these things will have increased transmission.
Due to the less stringent measures this time around, it will mean that it will take longer for the incidence of the virus to reduce. (We could have timed measures around the half term holiday, which would have meant that the measures were more effective).
The delay in the system - the time for people to be infected, to be hospitalised, and in some cases to sadly die, means that we will not see the effects of #lockdown2 immediately.
In fact, it may be a few weeks time - around the time when the measures expire - that we see the full effects in terms of deaths.
We should take note of three things: 1. Hospitalizations and deaths will not come down immediately as a result of these restrictions 2. This is a less stringent lockdown, so will take longer 3. Even if R reduces to below 1 on 2 December, we will still have a high incidence
• • •
Missing some Tweet in this thread? You can try to
force a refresh
The updated SPI-M slides - a short thread on what's changed.
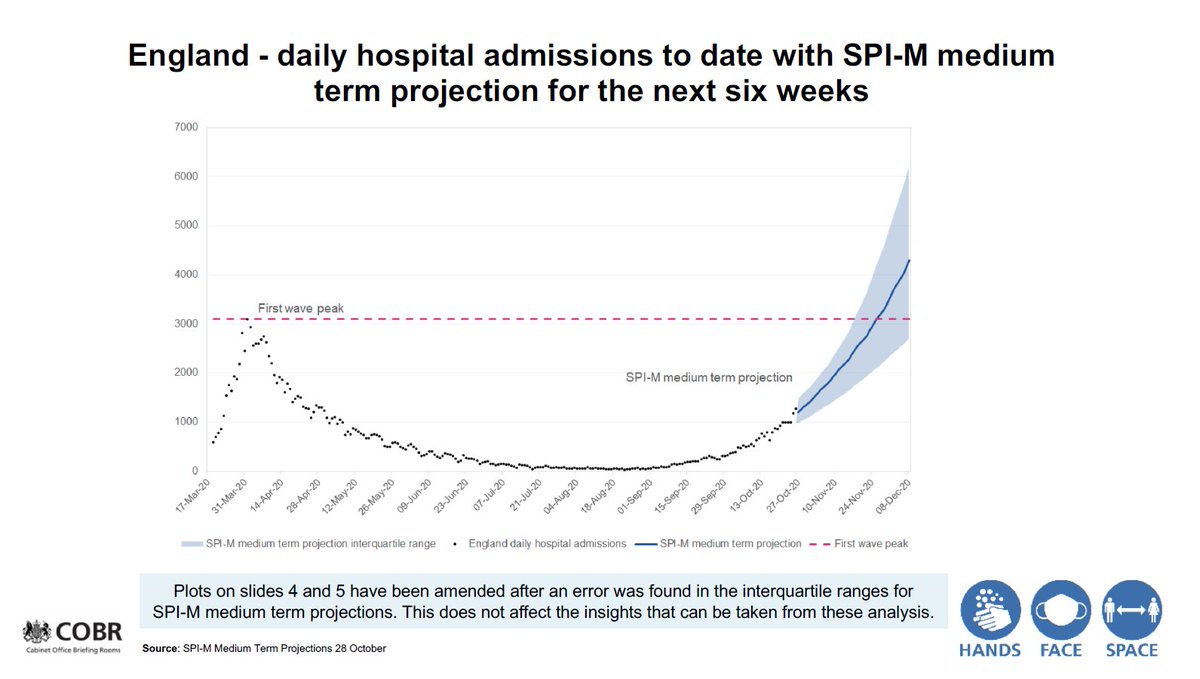
On 31 September, in a hastily arranged press conference, the Chief Scientific Adviser presented these two slides, showing projections for hospital admissions and deaths.
These were subsequently revised
The first slide shows a *projection* for hopsital admissions. On the left, the oringial slide, on the right, the amended slide.
These slides present a *range* of the projection (the shaded blue area), and a central projection (the dark blue line).
The upper level for the range of the projection has changed but *the central projection* (the dark blue line) *has not changed*
"Surveillance indicators suggest that COVID-19 activity at a national level has increased or remained high during week 44.
"Positivity rates were highest in the 80+ year olds tested through both Pillar 1 (NHS and PHE testing) and in the 10 to 19 year olds tested through Pillar 2 (community testing)."
(positivity indicates whether enough testing is being done)
Levelling off in Pillar 2 cases. However, this is due to testing capacity issues &/or not enough people coming forward.
Positivity in Pillar 2 unacceptably high (not enough testing)
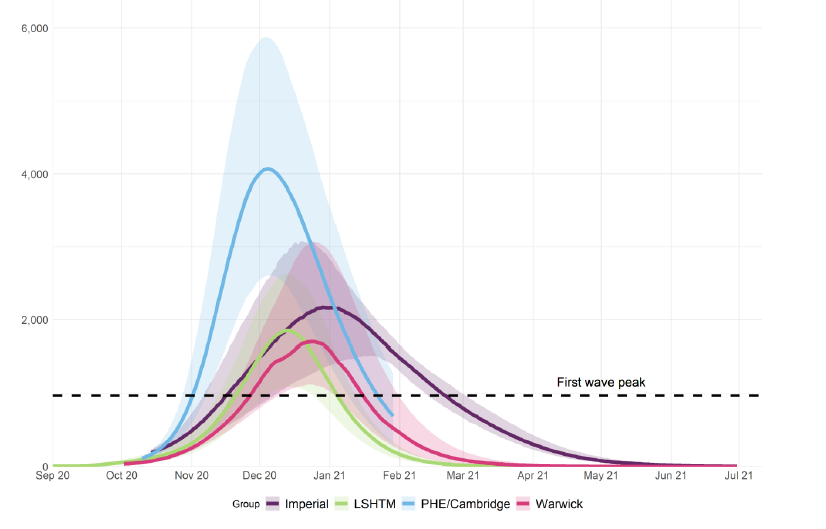
A thread on the modelling and analysis used to suggest scenarios for what *could* happen if we do nothing. And commentary on this slide.
The slides that were presented in the Number 10 press conference on 31 October are here: gov.uk/government/pub…
Firstly, commentary on the modelling. Modelling for Covid-19 is performed by a number of academic groups around the country. They use different modelling techniques. Some of these models are used to come up with the R value.
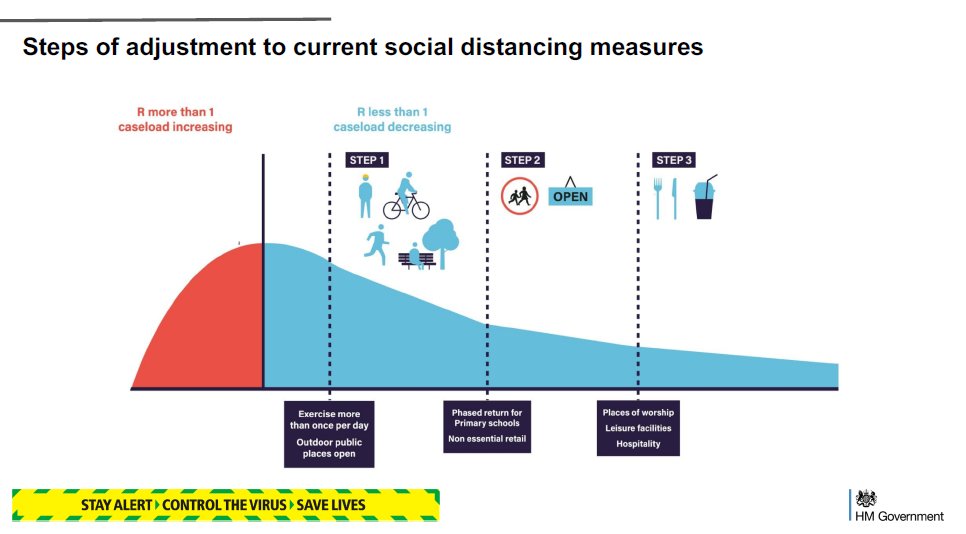
Let's take a little review of where we are with UK Covid restrictions.
It wasn't meant to be like this.
A Thread.
With apologies to Nandos.
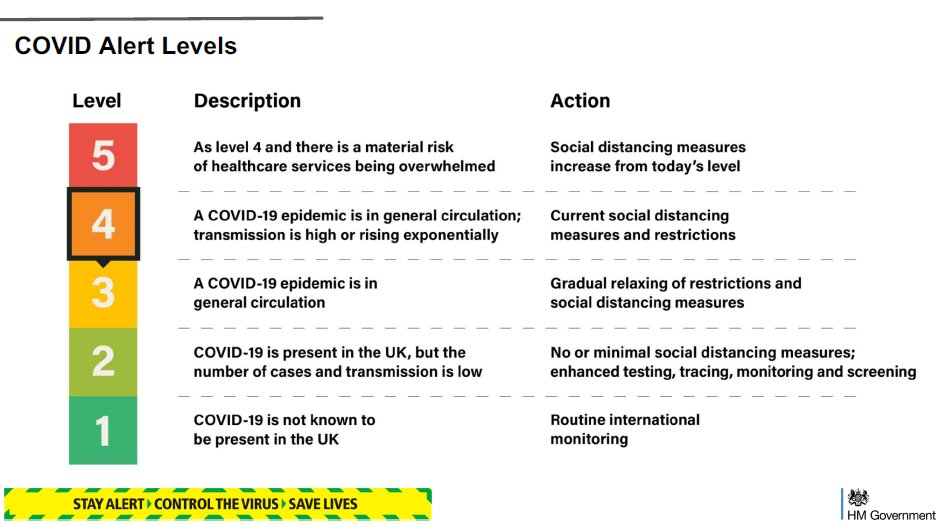
It wasn't meant to be like this. Remember the Alert Levels (the 'Nandos chart')? The whole idea of that was to set some sort of policy - a roadmap if you will - of how we get out of a national lockdown.
As a society, we are so divorced from the mechanisms of death that we are forgetting that the people dying of Covid are parents, siblings, grandparents. It is all too easy too look at statistics and be removed from the real lives that are cut short from this dreadful disease
A journalist has just deleted their tweet saying that the average age of those dying from Covid is 82, as if in some way that reduces the tragedy of that individual death.
And to refute the belief that it's 'only' old people - these are the people dying from Covid in the second wave (from @PHE_uk).
Over 1,000 70-somethings
Hundreds of 50-60 year olds and 60-70 year olds