The updated SPI-M slides - a short thread on what's changed.

On 31 September, in a hastily arranged press conference, the Chief Scientific Adviser presented these two slides, showing projections for hospital admissions and deaths.

These were subsequently revised
The first slide shows a *projection* for hopsital admissions. On the left, the oringial slide, on the right, the amended slide.

These slides present a *range* of the projection (the shaded blue area), and a central projection (the dark blue line).
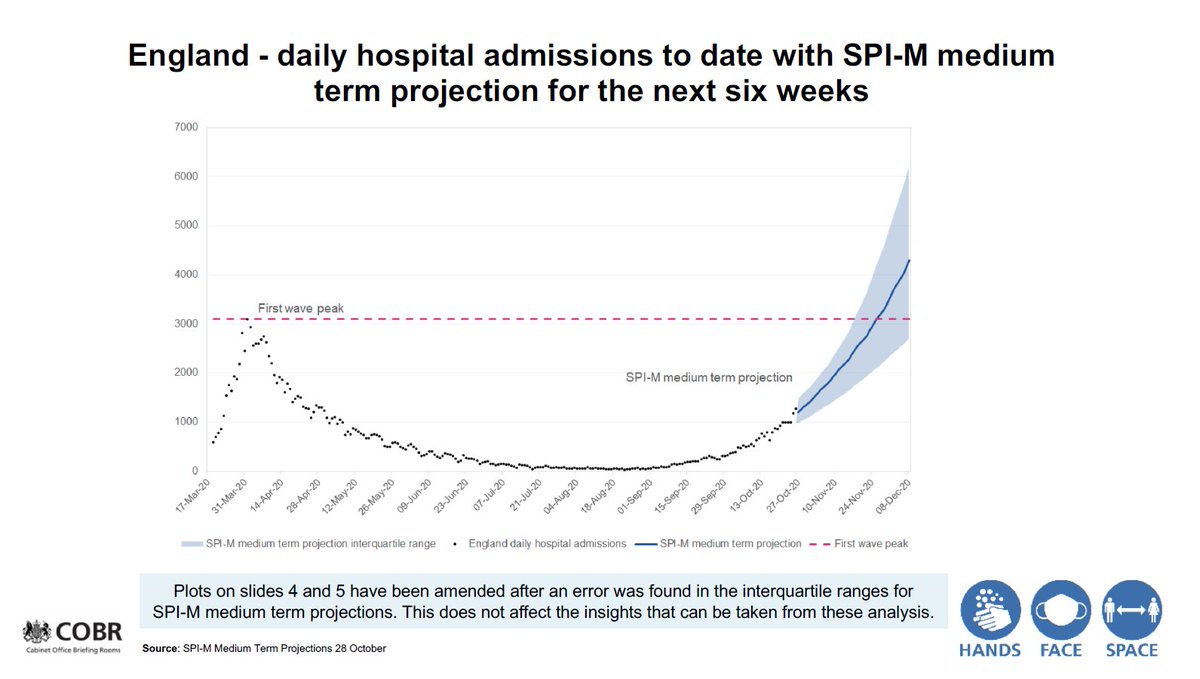
The upper level for the range of the projection has changed but *the central projection* (the dark blue line) *has not changed*
Same thing for deaths. On the left, the original slide, on the right, the revised slide. Similarly, the upper range has narrowed but *the central projection has not changed*

And remember, sadly deaths lag hospitalizations.
Here's a link to the story in the papers - it's bright yellow, so shows up more than the graphs used in the press conference.

Also, the headline 'Covid charts were wrong and death toll *will not* surpass first wave' is a strong statement.

telegraph.co.uk/news/2020/11/0…
(* the press conference was on 31 October, not 31 September(!))

Slides here:
gov.uk/government/pub…
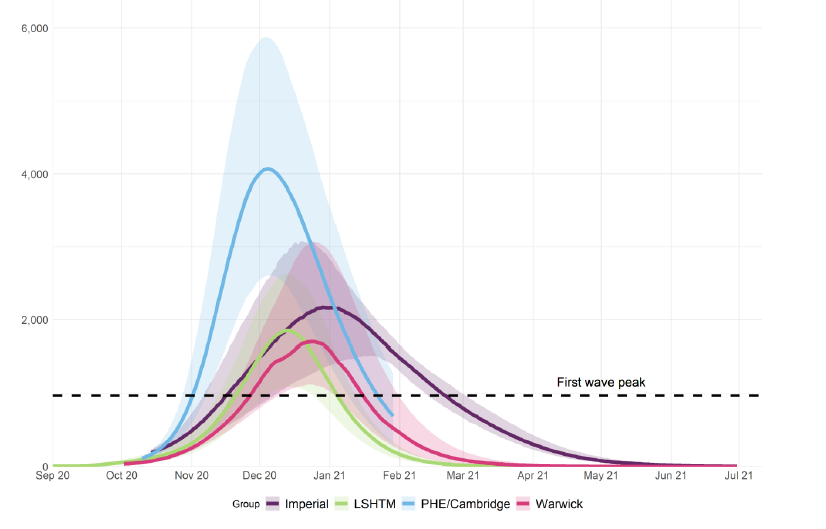
For those who have a newly-found interest in modelling, here are the academic articles that you can dive into.
For those that call the models flawed, please do publish a paper showing *why*. That's how science works.
And while we're here, let us not lose sight of the fact that these are not just numbers - there are real people behind the statistics

Some quotes from me about this in the @guardian (please read the article, not the headline)

theguardian.com/world/2020/nov…
Looking forward to speaking to @AndrewCastle63 on @LBC tomorrow (Saturday) at 8:20am about the SPI-M / SAGE modelling
My interview this morning with @AndrewCastle63 on @LBC discussing SAGE / SPI-M Charts, Graphs, Data, and Modelling

• • •

Missing some Tweet in this thread? You can try to force a refresh
 

Keep Current with Dr Duncan Robertson

Dr Duncan Robertson Profile picture

Stay in touch and get notified when new unrolls are available from this author!

Read all threads

This Thread may be Removed Anytime!

PDF

Twitter may remove this content at anytime! Save it as PDF for later use!

Try unrolling a thread yourself!

how to unroll video
  1. Follow @ThreadReaderApp to mention us!

  2. From a Twitter thread mention us with a keyword "unroll"
@threadreaderapp unroll

Practice here first or read more on our help page!

More from @Dr_D_Robertson

7 Nov
Here is my latest heatmap of detected Covid-19 cases in England. Data from @PHE_uk

*** 177 *** cases per 100,000 in the over-80s.

There were **8** cases per 100,000 in the over-80s in late August.

See the positivity chart in this thread to show that many cases go undetected. Image
Colourblind-safe heatmap of detected Covid-19 cases in England. Data from @PHE_uk Image
Positivity of tests for males in Pillar 2. Anything above 5% means we are not testing enough people.

*All* age groups in males are not tested sufficiently.

There is a significant issue with males not being tested sufficiently. Image
Read 6 tweets
5 Nov
Public Health England have published their Covid-19 surveillance report for week 45 relating to data from week 44 (26 Oct - 1 Nov)

assets.publishing.service.gov.uk/government/upl…

"Surveillance indicators suggest that COVID-19 activity at a national level has increased or remained high during week 44.
"Positivity rates were highest in the 80+ year olds tested through both Pillar 1 (NHS and PHE testing) and in the 10 to 19 year olds tested through Pillar 2 (community testing)."

(positivity indicates whether enough testing is being done)
Levelling off in Pillar 2 cases. However, this is due to testing capacity issues &/or not enough people coming forward.

Positivity in Pillar 2 unacceptably high (not enough testing)
Read 17 tweets
5 Nov
Day 1 of #Lockdown2.

This is not as stringent a lockdown as before - children are still at school (which has benefits for the children), and people are less apprehensive than the first lockdown.
The lockdown was announced in advance, and we have seen people go to shops yesterday in great numbers to ensure they have the products they want.

And yesterday was seen by some as the last chance for a gathering.

Both these things will have increased transmission.
Due to the less stringent measures this time around, it will mean that it will take longer for the incidence of the virus to reduce. (We could have timed measures around the half term holiday, which would have meant that the measures were more effective).
Read 6 tweets
4 Nov
A thread on the modelling and analysis used to suggest scenarios for what *could* happen if we do nothing. And commentary on this slide.
The slides that were presented in the Number 10 press conference on 31 October are here:
gov.uk/government/pub…
Firstly, commentary on the modelling. Modelling for Covid-19 is performed by a number of academic groups around the country. They use different modelling techniques. Some of these models are used to come up with the R value.
Read 26 tweets
2 Nov
Right then. A little thread about 'focused protection'.

Focused protection appears to be the new 'herd immunity', rebranded to sound nice and comforting.

Problem is, it's anything but.

Here's some background to where the term came from.
bmj.com/content/371/bm…
We *already* have 150 cases per 100,000 in the over-80s. That's hundreds of deaths in the coming weeks.

There were fewer than 10 cases per 100,000 in the over-80s in August. So that's a 16-fold increase, which works out as doubling every 2 weeks.
There's also some discussion about the 82-year-old - the median age for people dying from Covid.

Read this thread - those 82-year-olds can be expected to reach 90 if they don't catch Covid.

Read 4 tweets
28 Oct
Let's take a little review of where we are with UK Covid restrictions.

It wasn't meant to be like this.

A Thread.

With apologies to Nandos.
It wasn't meant to be like this. Remember the Alert Levels (the 'Nandos chart')? The whole idea of that was to set some sort of policy - a roadmap if you will - of how we get out of a national lockdown.

Introducing... Covid Alert Levels. 12 May

gov.uk/government/pub…
Remember this? The gentle ski slope of calm.

'R less than 1 caseload decreasing'

Ah, simpler times.
Read 18 tweets

Did Thread Reader help you today?

Support us! We are indie developers!


This site is made by just two indie developers on a laptop doing marketing, support and development! Read more about the story.

Become a Premium Member ($3/month or $30/year) and get exclusive features!

Become Premium

Too expensive? Make a small donation by buying us coffee ($5) or help with server cost ($10)

Donate via Paypal Become our Patreon

Thank you for your support!

Follow Us on Twitter!