#Canadians
In the last 7 days, there were 3,225 new #COVID19 cases in long-term/personal care & retirement homes.
995: ON
913: QC
567: AB
390: BC
334: MB
26: SK
0: Atlantic
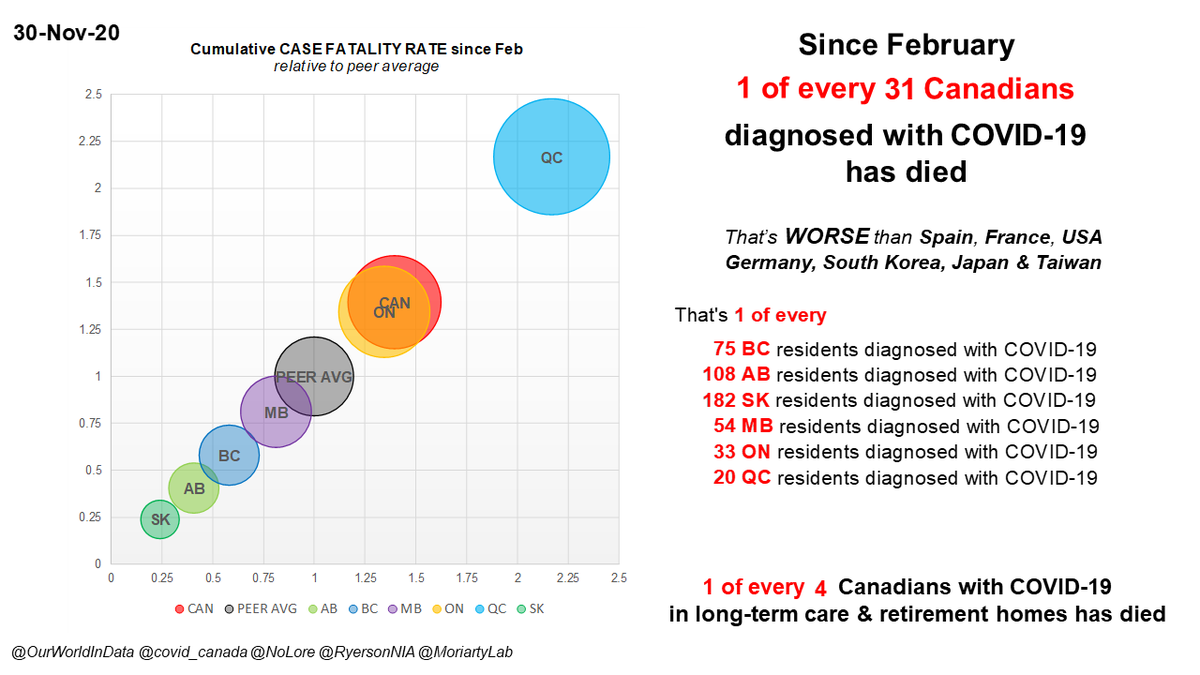
1 of 4 Cdns w/ C19 in LTC/RH has died to date. We can expect 806 LTC deaths from this wk's cases alone.
In the last 7 days, there were 3,225 new #COVID19 cases in long-term/personal care & retirement homes.
995: ON
913: QC
567: AB
390: BC
334: MB
26: SK
0: Atlantic
1 of 4 Cdns w/ C19 in LTC/RH has died to date. We can expect 806 LTC deaths from this wk's cases alone.
Here's what the per capita case numbers look like for all provinces. Atlantic is all Atlantic provinces. North is YK, NWT, Nunavut. Wave 2 is since Aug 17.
AB now has more per cap LTC/RH cases than ON, which takes some doing. QC & MB....horrific.
AB now has more per cap LTC/RH cases than ON, which takes some doing. QC & MB....horrific.

Look at the table in this image.
In Wave 1, ending Aug 17, #Canada had 48 #COVID19 cases in LTC/RHs per 100K people.
In Wave 2, starting Aug 18, we already have 50% more (73), and LTC/RH case numbers are accelerating (not just increasing steadily).
In Wave 1, ending Aug 17, #Canada had 48 #COVID19 cases in LTC/RHs per 100K people.
In Wave 2, starting Aug 18, we already have 50% more (73), and LTC/RH case numbers are accelerating (not just increasing steadily).

QC already has 3X the national avg from Wave 1.
MB is more than 2X higher, AB 1.5X higher, w/ cases absolutely sky-rocketing.
ON has surpassed the national W1 avg & is also accelerating (not just increasing steadily).
MB is more than 2X higher, AB 1.5X higher, w/ cases absolutely sky-rocketing.
ON has surpassed the national W1 avg & is also accelerating (not just increasing steadily).
We don't get to engage in theatrical hand-wringing when this is over, talking about how sad the LTC/RH deaths were, & how provinces, homes themselves should have done better.
We don't get to be angry only at them.
WE (me, you everyone) are letting this happen.
#StayHome FFS
We don't get to be angry only at them.
WE (me, you everyone) are letting this happen.
#StayHome FFS
I'll post the nightly death thread tonight, after the last ON numbers are posted for the night. It's usually by about 9:30 or 10 EST. I pin it to my profile.
Topline: deaths are really accelerating.
OK. Back to regular work.
If you can, #StayHome. Protect others.
Topline: deaths are really accelerating.
OK. Back to regular work.
If you can, #StayHome. Protect others.
bloody forgot to say: case data are thanks to @RyersonNIA
• • •
Missing some Tweet in this thread? You can try to
force a refresh


