#MarketUpdate THREAD

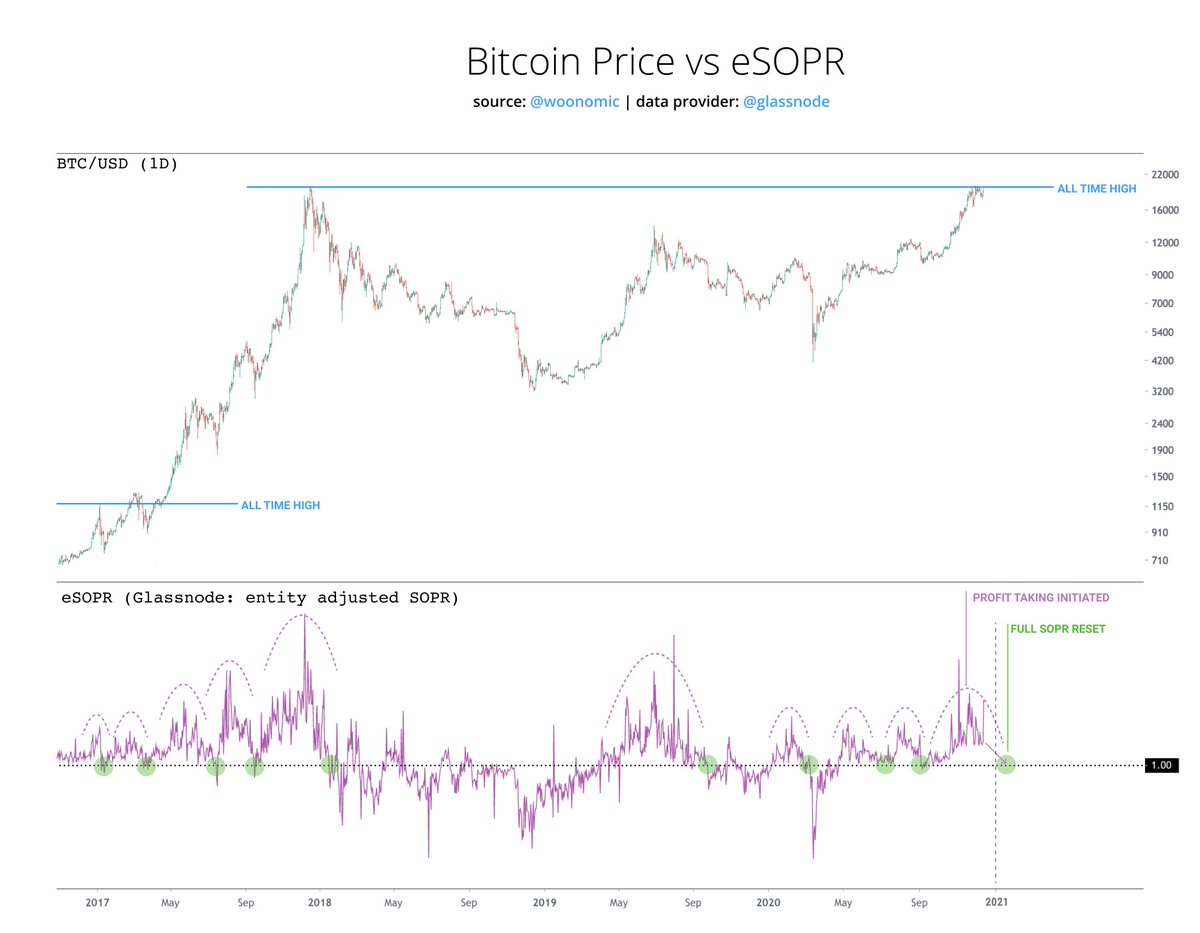
SOPR is the chart I care most about RN.

Profit-takers initiated weeks ago, we need to wait until they exhaust before there's full freedom to explore new highs.

It's a waiting game, likely until Jan 2021 for a full reset.

Till then beware of bull traps. Image
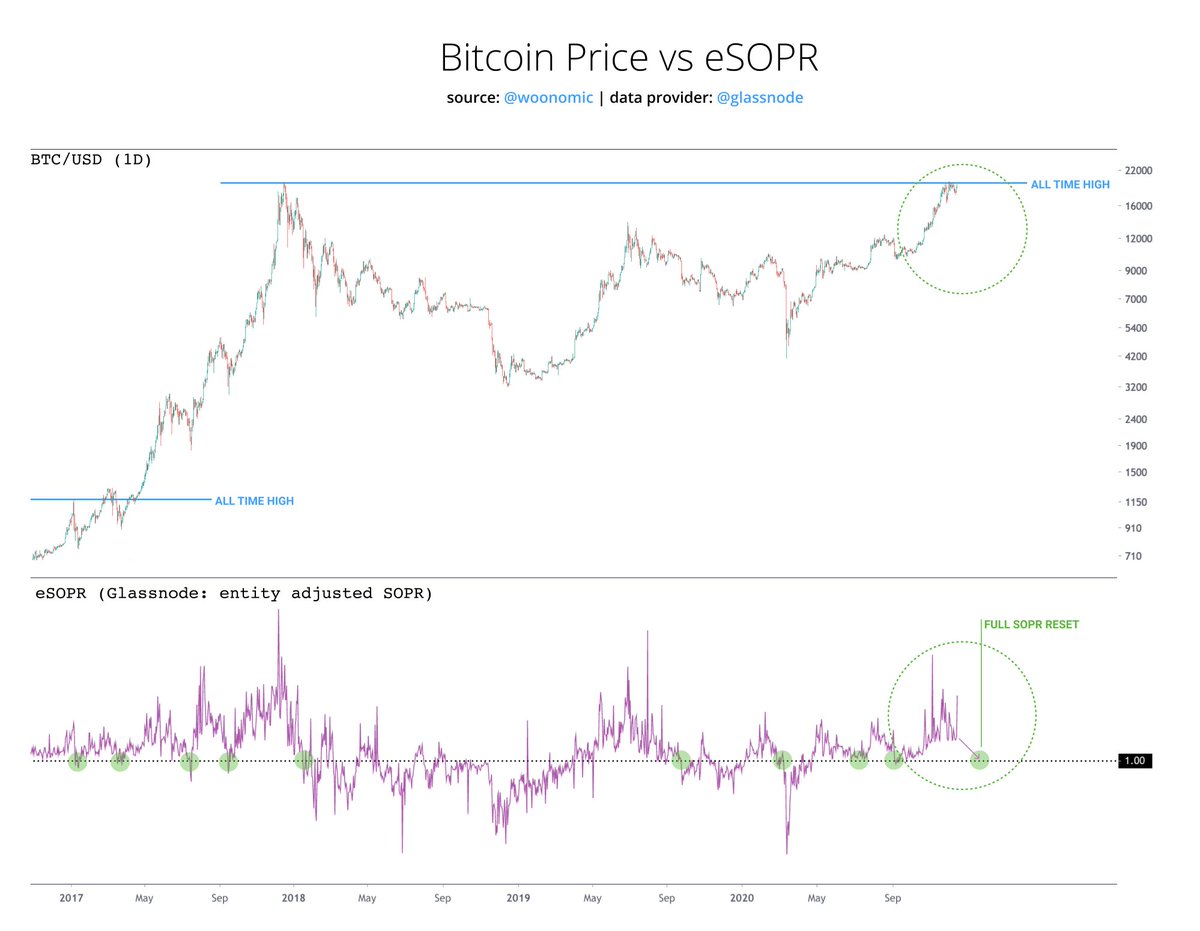
SOPR by @renato_shira is a lie-proof "survey of investors to determine their profit or loss for the coins that transacted in a day". We like to use SOPR because all investors lie about their losses and on-chain guys like smart sounding acronyms.

More details here: Image
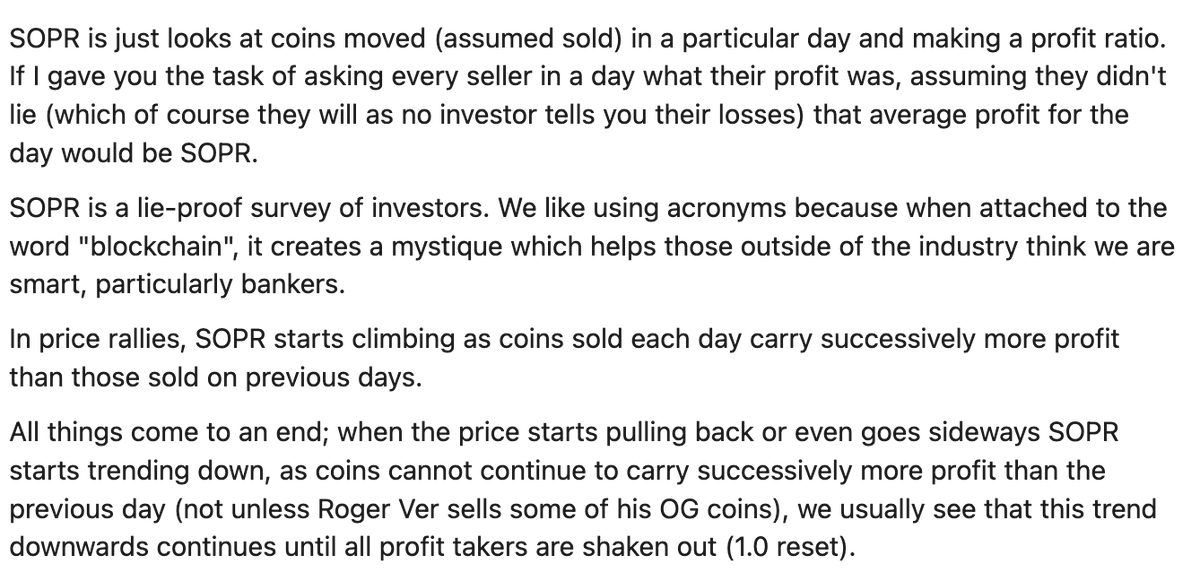
Once SOPR starts declining, profit taking begets profit taking. We wait until all investors in profit who are going to sell to complete their sell off, when this happens, coins moving no longer carry profit, SOPR goes to 1.0, and we can move forward. ETA January perhaps. Image
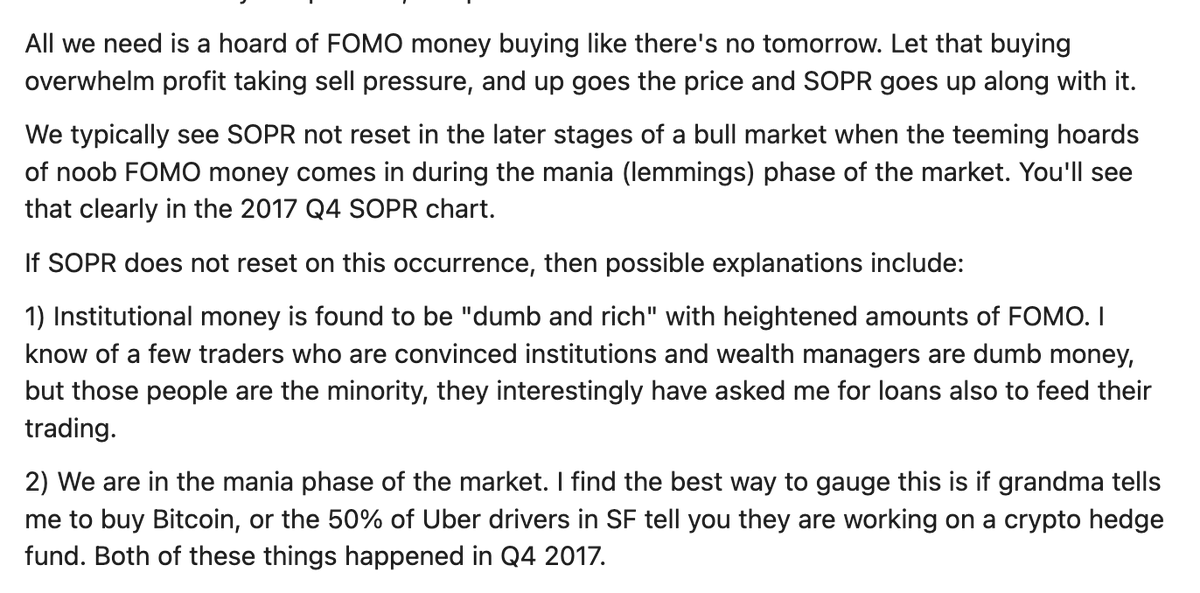
Is it possible for SOPR not to reset? Yes, that's the grandma telling me to buy BTC signal. Image
I've used eSOPR in this analysis which is @glassnode's improvement over the original SOPR by viewing only coins moving between DIFFERENT investors (we do this by forensic clustering addresses together that smell like they belong to the same person).

eSOPR Datasource: @glassnode
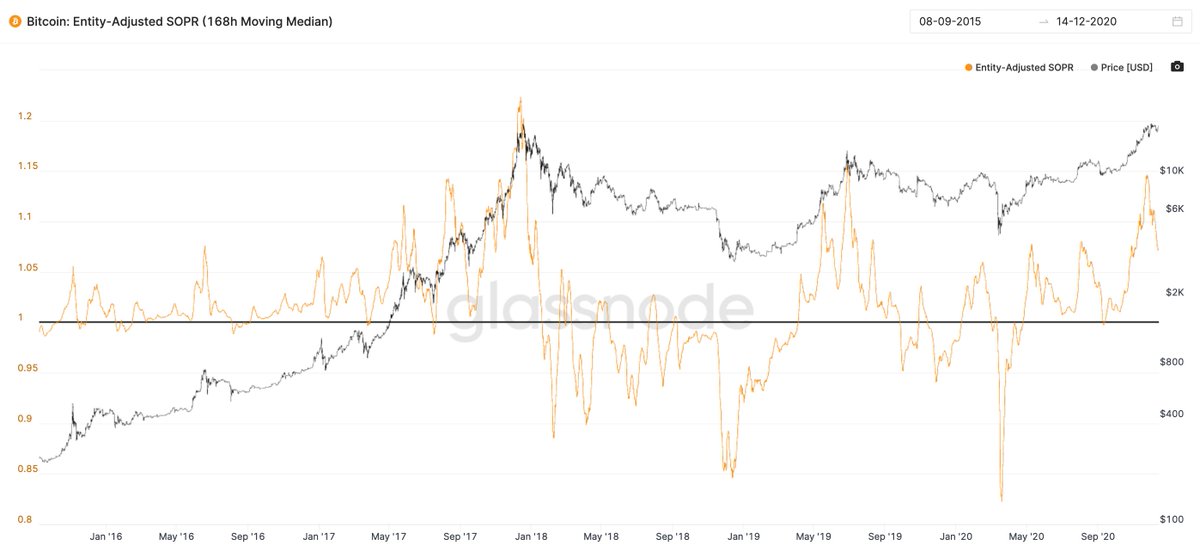
A clearer view. eSOPR 1-week moving median. Image

• • •

Missing some Tweet in this thread? You can try to force a refresh
 

Keep Current with Willy Woo

Willy Woo Profile picture

Stay in touch and get notified when new unrolls are available from this author!

Read all threads

This Thread may be Removed Anytime!

PDF

Twitter may remove this content at anytime! Save it as PDF for later use!

Try unrolling a thread yourself!

how to unroll video
  1. Follow @ThreadReaderApp to mention us!

  2. From a Twitter thread mention us with a keyword "unroll"
@threadreaderapp unroll

Practice here first or read more on our help page!

More from @woonomic

5 Oct
#bitcoin in public company treasuries has exceeded 200,000 BTC.

Live chart: charts.woobull.com/bitcoin-etf-co…
Added: @exodus_io (ticker: EXOD)
Updated: Galaxy Digital, Hut8Mining, Riot Blockchain, Marathon, Bitfarms

Not all Q4 quarterly filings have been updated so these numbers are expected to be the conservative lower bound.
Contribute new data via the Google spreadsheet: docs.google.com/spreadsheets/d…
Read 4 tweets
29 Sep
Deep inside baseball for on-chain analysts...

This is @glassnode's Illiquid Supply adjusted for drift.

The implication is that the raw data will give overly bullish signals, in reality we are NOT at all time highs of Illiquid Supply.
Primer... there's 3 classification of owners:

Illiquid - coins owned by "Rick Astley", the people who buy without much selling activity.

Liquid - coins owned by HODLers who buy and sell

Highly Liquid - coins owner by highly speculative people who mainly trade
The reason why Illiquid Supply is over estimated lies in how Illiquid Supply is derived.

It uses heuristics to cluster wallet addresses together into distinct owners (entities).

As more data comes in, more knowledge comes to light...
Read 9 tweets
13 Sep
I posted this map of the BTC supply distribution, but many asked "but what does this mean?".

Well, it says quite a lot, this is the whole ecosystem talking to us. Since people didn't see what I though was in plain sight, I'll break it down and add a bit more colour.

👇
1) Most importantly.

Bitcoin continues to distribute coins evenly. Publicly held and retail entities continue to gain more control of the supply while whales are reducing their control.

Remember the gold standard failed as a monetary standard due to centralisation of the supply
2) Retail drives macro cycles. When retail stack their sats at an increased rate, like they are doing right now, it's the fundamentals saying we are in the middle of a bull market.

I repeat; middle of a bull market. Traders in disbelief 2 months ago when this data was shown.
Read 6 tweets
5 Sep
Supply Shock valuation model.

Uses a look-back algo to determine what the market priced BTC at prior demand and supply situations.

Currently puts BTC above $55k.

It's conservative as one of the SS metrics, exchange SS, is now above all-time-high so no look-back is possible.
Interpolated best fit line.
Read 4 tweets
10 Aug
Ethereum supply shock well and truly at all time highs.

Looks like the market overpriced it in May but is probably underpricing it July / August.
Switching to an oscillator view of this, it's moving out of its no-brainer buy zone with the latest rally. But importantly, despite short term technicals being quite warm, it's far from over-bought on fundamentals.
On-chain data by @glassnode.

Note: the latest supply burn from EIP-1559 is not accounted for in Glassnode data. But it should not impact these metrics just yet (~0.01% impact on this indicator for now). Glassnode will be rolling in EIP-1559 burn data soon.
Read 5 tweets
6 Aug
Just a matter of patience and time before $42k breaks.

Strong HODLers, the Rick Astleys of this world, have been taking this opportunity to scoop large amounts of coinage while we're under the resistance ceiling. Image
Mid-macro view:
90 day moving average of coins moving to Mr Astley about to cross bullish. Image
The movement of coins to and from Mr Astley brought to you via forensic clustering of on-chain data courtesy of @glassnode.
Read 4 tweets

Did Thread Reader help you today?

Support us! We are indie developers!


This site is made by just two indie developers on a laptop doing marketing, support and development! Read more about the story.

Become a Premium Member ($3/month or $30/year) and get exclusive features!

Become Premium

Too expensive? Make a small donation by buying us coffee ($5) or help with server cost ($10)

Donate via Paypal Become our Patreon

Thank you for your support!

Follow Us on Twitter!

:(