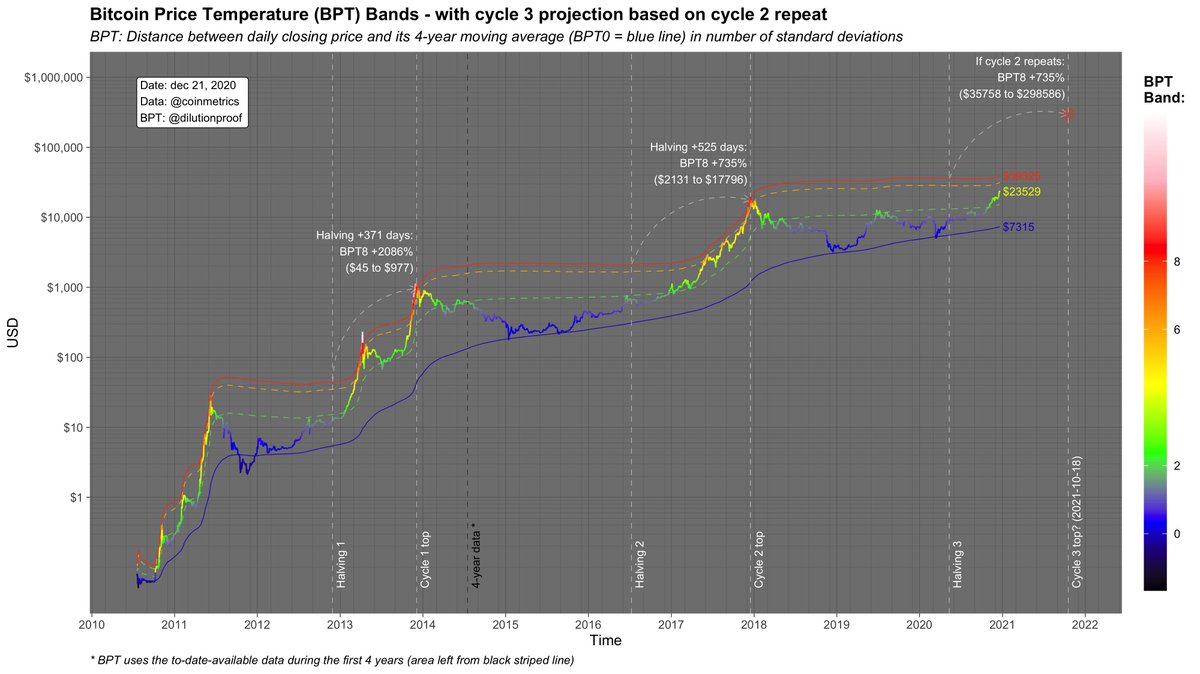
1/10 A rough prediction using the #Bitcoin Price Temperature (BPT) Bands:
If the current #Bitcoin post-halving bull run has a similar growth & volatility as the last one, this cycle could top at around $300k in October 2021 👀
Q&A with interpretation & nuances in this thread 👇
If the current #Bitcoin post-halving bull run has a similar growth & volatility as the last one, this cycle could top at around $300k in October 2021 👀
Q&A with interpretation & nuances in this thread 👇
2/10 Q: What Is the #Bitcoin Price Temperature (BPT)?
A: The BPT reflects the relative distance between the #Bitcoin price & its 4-year moving average. High BPT values represent potentially (over)heated price levels. 🌡️
More in this thread & article:
A: The BPT reflects the relative distance between the #Bitcoin price & its 4-year moving average. High BPT values represent potentially (over)heated price levels. 🌡️
More in this thread & article:
https://twitter.com/dilutionproof/status/1338942312437706756?s=20
3/10 Q: What are the BPT Bands based on?
A: Technical Analysis:
- BPT0 (blue): the 4-year moving average
- BPT2 (green): both support & resistance levels at key market swings
- BPT6 (orange): resistance level during bull runs
- BPT8 (red): market cycles topped shortly afterwards
A: Technical Analysis:
- BPT0 (blue): the 4-year moving average
- BPT2 (green): both support & resistance levels at key market swings
- BPT6 (orange): resistance level during bull runs
- BPT8 (red): market cycles topped shortly afterwards

4/10 Q: Why use a 4-year time window?
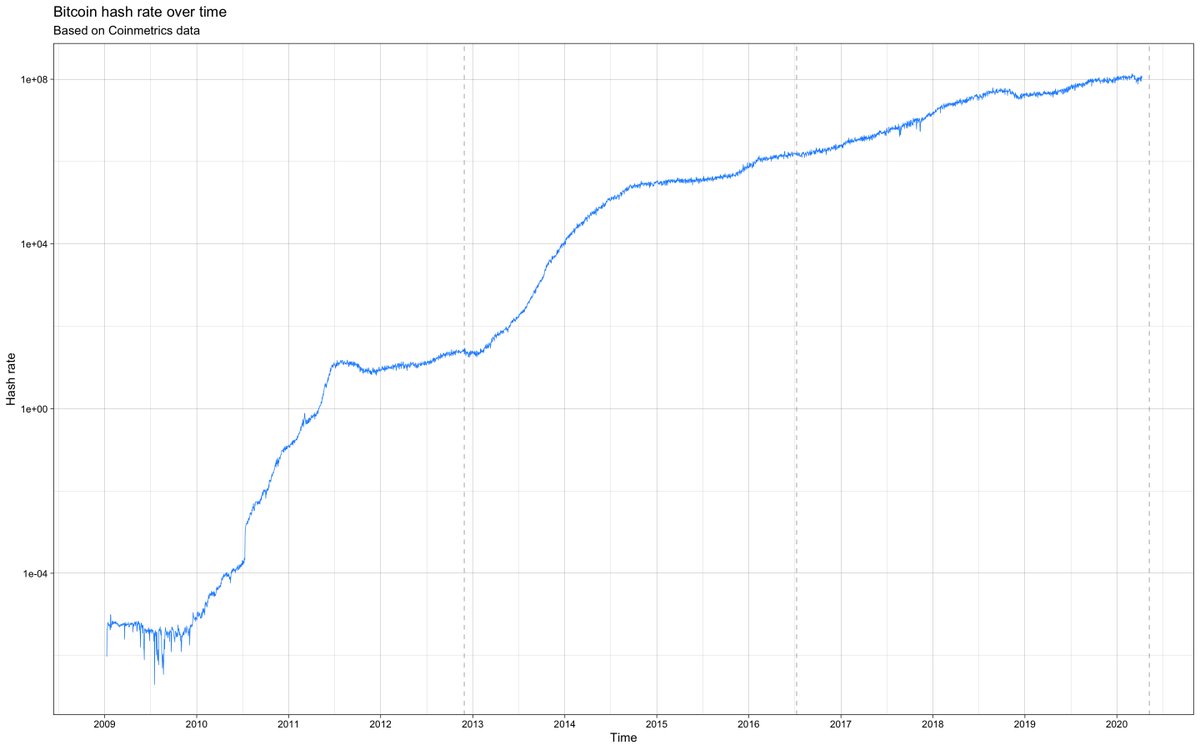
A: #Bitcoin's new supply issuance is halved every ~4 years, creating a supply shock that appears to drive up the price in the 1-1.5 years after.
This weekend, @btconometrics posted something interesting on this:
A: #Bitcoin's new supply issuance is halved every ~4 years, creating a supply shock that appears to drive up the price in the 1-1.5 years after.
This weekend, @btconometrics posted something interesting on this:
https://twitter.com/dilutionproof/status/1340746683169300482?s=20
5/10 Q: How did you get to October (18th) 2021 as a potential market top?
A: I calculated the difference between the previous halving (2016) and subsequent market top (2017) in number of days and added that to the date of the last (2020 halving.
A: I calculated the difference between the previous halving (2016) and subsequent market top (2017) in number of days and added that to the date of the last (2020 halving.

6/10 Q: How did you get to $300k as a potential market top?
A: I calculated the % growth of the BPT8 band between the previous cycle halving (2016) and top (2017) and used it to estimate what the BPT8 band price would be on October 18th, 2021.
A: I calculated the % growth of the BPT8 band between the previous cycle halving (2016) and top (2017) and used it to estimate what the BPT8 band price would be on October 18th, 2021.

7/10 Q: Can you just do that?
A: Technically yes, but this is a naïve approach that relies heavily on several assumptions:
- That this cycle will be similar to the last one. So far the BPT of both cycles is highly correlated (r=0.79) but no guarantees that it'll stay that way.
A: Technically yes, but this is a naïve approach that relies heavily on several assumptions:
- That this cycle will be similar to the last one. So far the BPT of both cycles is highly correlated (r=0.79) but no guarantees that it'll stay that way.

8/10 (continued)
- That this cycle's volatility will also be similar. E.g., if this cycle is more volatile, the BPT Bands will slope up faster due to how they are calculated (using the 4-year SD). Is the current cycle (orange) becoming more volatile than the last (yellow)? 👀
- That this cycle's volatility will also be similar. E.g., if this cycle is more volatile, the BPT Bands will slope up faster due to how they are calculated (using the 4-year SD). Is the current cycle (orange) becoming more volatile than the last (yellow)? 👀

9/10 Q: What if I believe in the 4-year cycles, but think that the max returns will be a bit lower again this cycle?
A: That scenario probably aligns best with @btconometrics' latest work, who estimates the current cycle to top at around $150k next year:
A: That scenario probably aligns best with @btconometrics' latest work, who estimates the current cycle to top at around $150k next year:
https://twitter.com/dilutionproof/status/1340746636851613698?s=20
10/10 Q: Why not use the first halving cycle?
A: Because the current cycle is not very similar to the first halving cycle at all (no correlation), so right now there is no reason to believe we'll follow that trajectory. (If it did, we'd get a $782k BPT8 price on May 17th, 2021.)
A: Because the current cycle is not very similar to the first halving cycle at all (no correlation), so right now there is no reason to believe we'll follow that trajectory. (If it did, we'd get a $782k BPT8 price on May 17th, 2021.)

• • •
Missing some Tweet in this thread? You can try to
force a refresh


