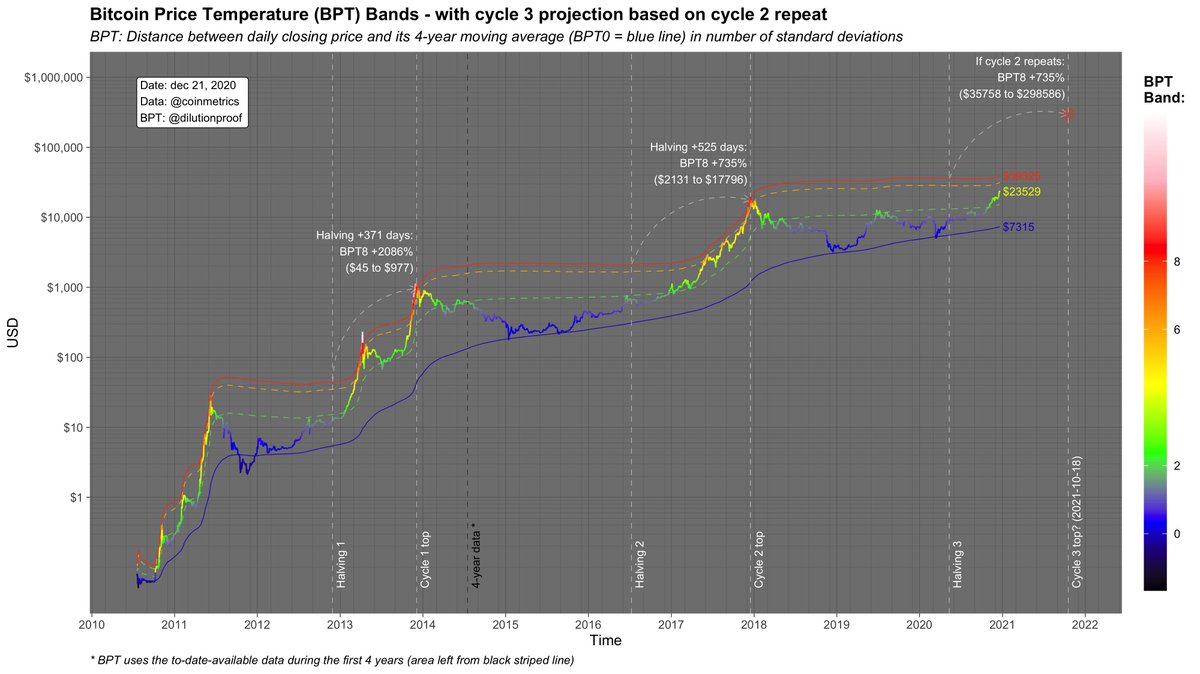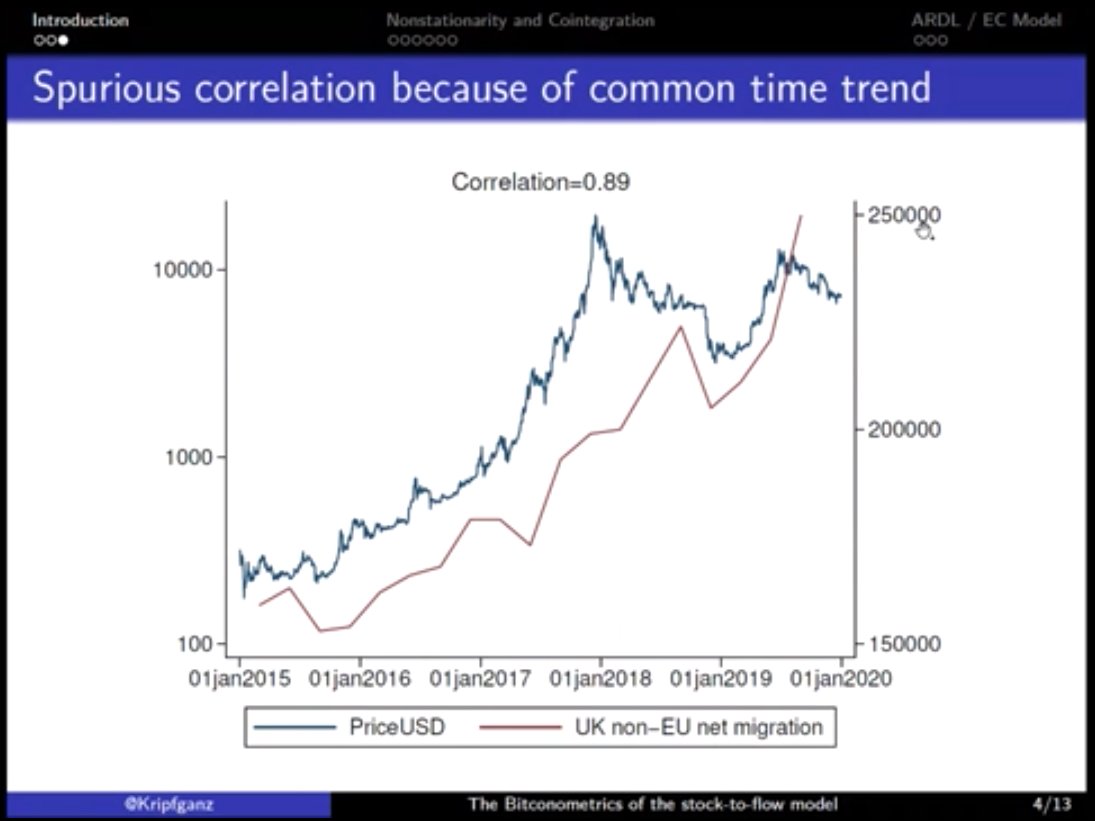
1/8 Are you also excited about #Bitcoin's future? 🔥
Seven bullish #Bitcoin narratives for 2021:
1) Supply shortage ⚖️
2) Stimulus checks 💰
3) Stock-to-Flow (S2F) model 📈
4) Chasing gold 🥇
5) Bitcoin ETF 🕴️
6) Taproot 🌱
7) Lightning ⚡️
Thread 👇
Seven bullish #Bitcoin narratives for 2021:
1) Supply shortage ⚖️
2) Stimulus checks 💰
3) Stock-to-Flow (S2F) model 📈
4) Chasing gold 🥇
5) Bitcoin ETF 🕴️
6) Taproot 🌱
7) Lightning ⚡️
Thread 👇
2/8 Due to institutional FOMO, an unprecedented # of #Bitcoin were withdrawn from exchanges in 2020, exacerbating the halving-induced supply shortage
Due to #Bitcoin's inelastic supply, a supply shortage means a greater chance at 🚀 with new demand 🍾
Due to #Bitcoin's inelastic supply, a supply shortage means a greater chance at 🚀 with new demand 🍾
https://twitter.com/dilutionproof/status/1344031257974501376?s=20
3/8 Any USA citizen that saved their April 15h $1200 stimulus check in #Bitcoin would now have >$5000 (+318%)
With new stimulus checks coming in & more awareness of inflation, it is possible we'll see some buying pressure for hard assets come in soon 👀
With new stimulus checks coming in & more awareness of inflation, it is possible we'll see some buying pressure for hard assets come in soon 👀
https://twitter.com/BitcoinStimulus/status/1344146597446381568?s=20
4/8 Love it or hate it, but @100trillionUSD's Stock-to-Flow (S2F) model is holding up quite nicely due to #Bitcoin's recent steep price rise
If it stays on track, it is bound to remain a powerful 🐂 narrative in 2021
Chart by @hamal03
More on S2F: medium.com/swlh/modeling-…
If it stays on track, it is bound to remain a powerful 🐂 narrative in 2021
Chart by @hamal03
More on S2F: medium.com/swlh/modeling-…

5/8 #Bitcoin's S2F is already close to gold's & will surpass it in 2024 🥇
As gold's up-and-coming hard money nephew, will #Bitcoin's total market value grow towards that of gold as well?
If it does, it would mean a current #Bitcoin price of ~$641k 👀
As gold's up-and-coming hard money nephew, will #Bitcoin's total market value grow towards that of gold as well?
If it does, it would mean a current #Bitcoin price of ~$641k 👀
https://twitter.com/dilutionproof/status/1344019867331141632?s=20
6/8 So far, every #Bitcoin ETF application has been dismissed by the SEC, but with a new & supposedly 'pro-crypto' chairman coming in, this could change
An ETF would increase the demand for #Bitcoin and thus its price 📈
PS: Not your 🔑s, not your 🪙s!
An ETF would increase the demand for #Bitcoin and thus its price 📈
PS: Not your 🔑s, not your 🪙s!
https://twitter.com/iamjosephyoung/status/1342124553619664896?s=20
7/8 Activation of the Taproot protocol upgrade could provide a more fundamental 🐂 narrative
At 91.05% hashrate support (
More on Taproot & activation by @AaronvanW: bitcoinmagazine.com/articles/bip-8…
At 91.05% hashrate support (
https://twitter.com/bitentrepreneur/status/1343142666536681472?s=20), we are close to the 95% threshold that was needed for SegWit 👀
More on Taproot & activation by @AaronvanW: bitcoinmagazine.com/articles/bip-8…
8/8 Finally, a 🐂 market comes with increased blockspace fees that are essential for long-term protocol security via mining rewards
Unlike 2017, we now have the ⚡️network that could be adopted to relieve fee pressure for small payments
Bring on 2021! 🥳
Unlike 2017, we now have the ⚡️network that could be adopted to relieve fee pressure for small payments
Bring on 2021! 🥳
https://twitter.com/dilutionproof/status/1273306757146738690?s=20
• • •
Missing some Tweet in this thread? You can try to
force a refresh


