For the small number of people who are not totally sick of #minimumwage threads, let me walk you through some of the @UW team's findings for #Seattle now that they've cleared peer review (conditionally accepted, AEJ:EP).
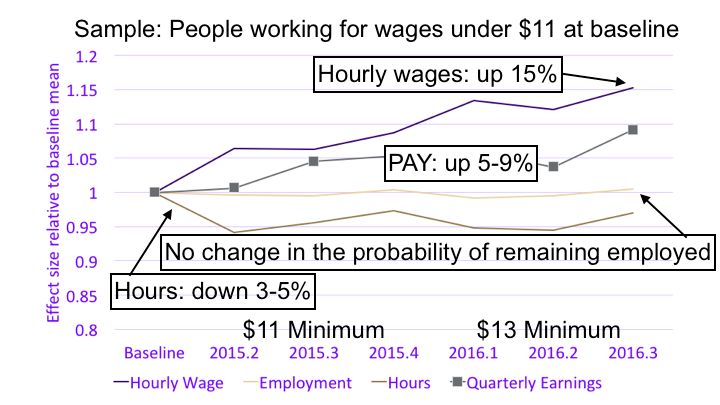
A lot of them are packed into this one picture.
A lot of them are packed into this one picture.
This isn't the analysis that used Synthetic Seattle and counted up the number of jobs paying under some threshold, except it couldn't count jobs at multi-location firms.
This is a longitudinal analysis of individual workers working for low pay in Washington as of early 2015.
This is a longitudinal analysis of individual workers working for low pay in Washington as of early 2015.
We follow these workers and tally up all their jobs, hours, and earnings. Multiple jobs? They all count. Switch to a multi-location employer? That jobs and its hours and earnings count.
We difference their experiences 2x: from workers elsewhere in WA & earlier cohort.
We difference their experiences 2x: from workers elsewhere in WA & earlier cohort.
In studying aggregate trends in Seattle using a hourly wage threshold, we risked overstating negative employment effects due to the "Seattle boom."
With the longitudinal analysis, the bias would go the other way: the Seattle boom should be pushing wages & employment up.
With the longitudinal analysis, the bias would go the other way: the Seattle boom should be pushing wages & employment up.
OK, so what do the data show? As the minimum wage rose from $9.47 to as much as $13 (that's 34%) between early 2015 and early 2016:
- Hourly wages went up gradually, ending at +15%
- P(unemployment) for these workers was unaffected.
- Hours declined 3-5%
- Pay went up 5-9%.
- Hourly wages went up gradually, ending at +15%
- P(unemployment) for these workers was unaffected.
- Hours declined 3-5%
- Pay went up 5-9%.
Our team benefited from access to statewide administrative data on hours worked. WA is one of only 4 states that collects that information.
Why is the action on the hours margin and not headcount employment? Bear in mind that most of this employment is part-time or seasonal.
Why is the action on the hours margin and not headcount employment? Bear in mind that most of this employment is part-time or seasonal.
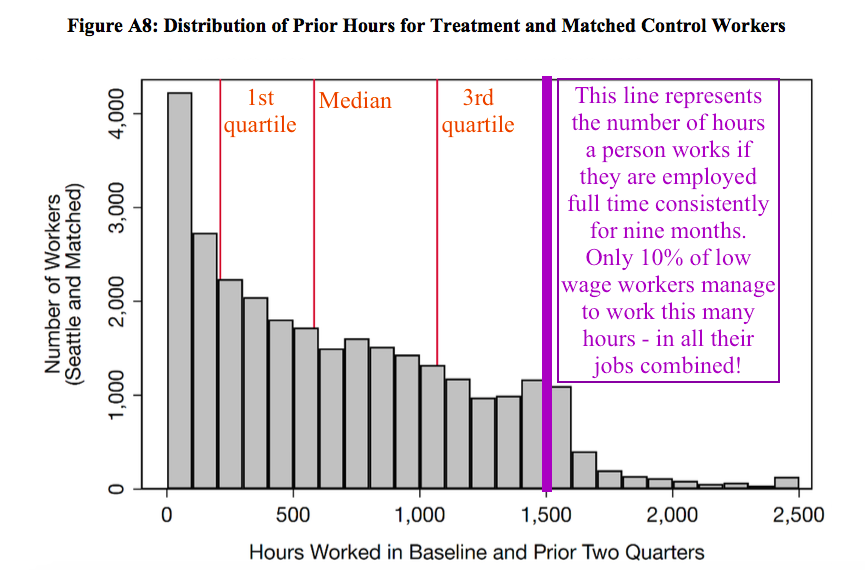
From the employer's perspective, headcount = the maximum number of people you can have working at any one time. When you're at your busiest.
A higher minimum wage, rather than change that number, appears to affect how you want to staff your business when it's not busy.
A higher minimum wage, rather than change that number, appears to affect how you want to staff your business when it's not busy.
As a 2016 report I wrote for the @SeattleCouncil indicates, employers (at that time) used a wide range of practices to cut staffing back in periods of slack demand. Send people home. Have them be "on call." Have them work split shifts.
seattle.gov/Documents/Depa…
seattle.gov/Documents/Depa…
Our results on hours point to effects-for workers employed at baseline-that moderate over time. The pattern suggests a game plan for higher labor costs:
1) Don't lay people off
2) Cut back hours
3) Cut back hiring
4) As workers quit, restore hours for those who remain
1) Don't lay people off
2) Cut back hours
3) Cut back hiring
4) As workers quit, restore hours for those who remain
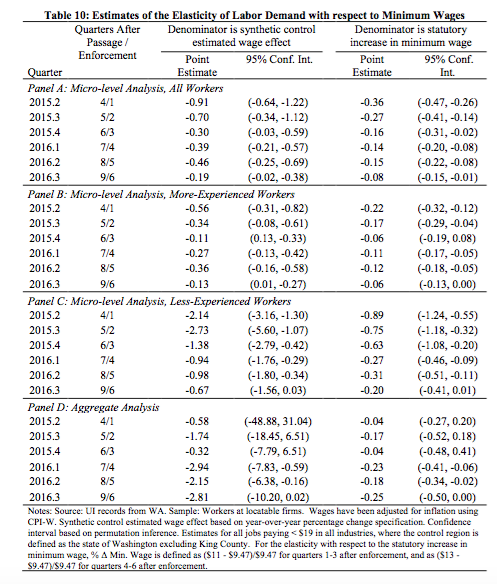
(Note that the elasticities in Panel A of the table above may understate employment effects both because of "Seattle boom bias" and because they completely ignore a subset of the workforce: those who didn't have jobs at baseline, before the wage increase. More on them soon.)
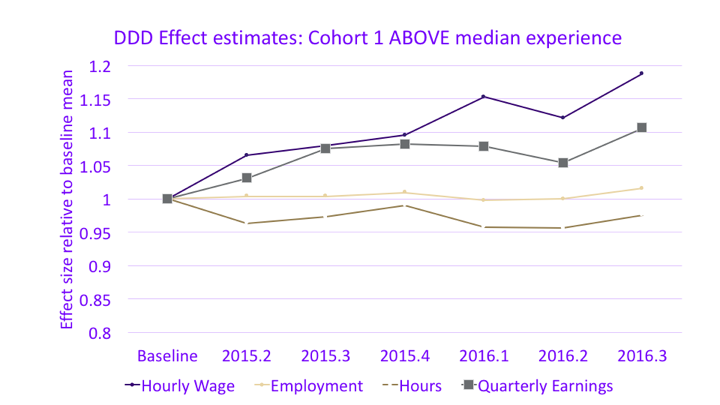
We found important differences between more and less experienced workers ("more experienced" here could also mean "with stronger labor force attachment."). The more experienced workers fared better
- hourly wages went up more
- hours cuts tended to be modest
- pay rose more.
- hourly wages went up more
- hours cuts tended to be modest
- pay rose more.
Less experienced workers saw greater proportionate cuts in hours and actually saw smaller paychecks for the first 15 months after the first wage increase.
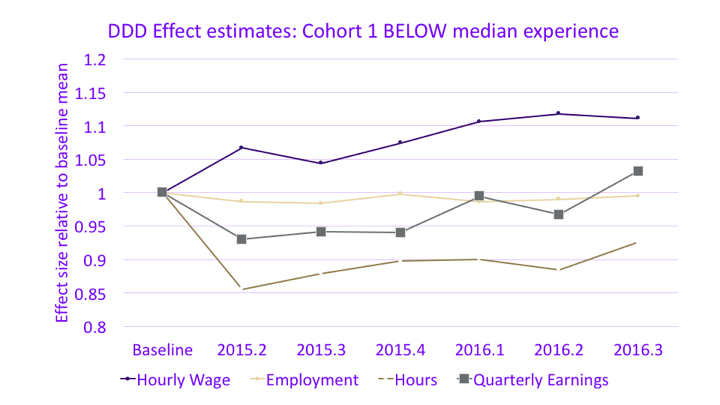
So here's the rub: if you favor a higher minimum wage as a strategy to increase the take-home pay of older workers supporting themselves, the evidence supports your argument. If you’re worried about adverse impacts on teenagers, this evidence supports your argument too.
This is a labor market where people who need income to survive compete against younger workers who need the experience more than the money, and will consequently work for very low pay.
Should such a market be regulated? That's one way to think about the minimum wage.
Should such a market be regulated? That's one way to think about the minimum wage.
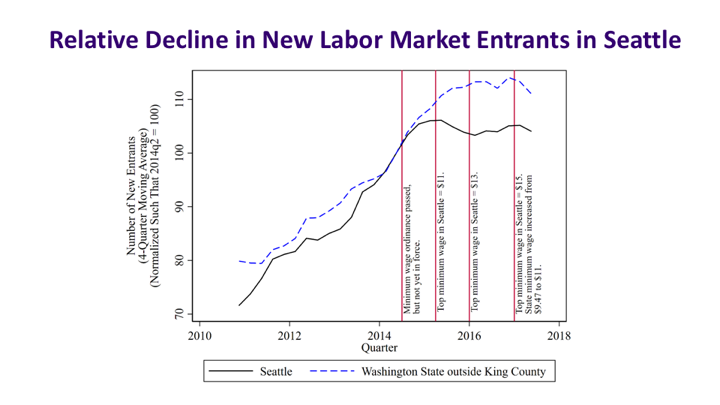
Now, the longitudinal analysis by necessity leaves out workers who did not yet have a job in early 2015. What inferences can we make about their experiences?
Well, our best guess is that there were fewer of them as the minimum wage increase phased in.
Well, our best guess is that there were fewer of them as the minimum wage increase phased in.
There's a lot more to the @UW Seattle Minimum Wage Study. Beyond the admin data analysis, our team conducted employer surveys, worker interviews, price studies, a non-profit analysis, and much more. You can check all that out here. evans.uw.edu/faculty-resear…
Caveats, of course! This is one policy in one city. Local policies likely have different effects than national policies. We didn't extend the analysis beyond 2016 because our "control group" -- Washington state -- started significant minimum wage increases in 2017.
But the bottom line is this: our evidence shows clear benefits of this policy. It also introduces cautions about costs -- cautions that prior studies have been unable to deliver for lack of reliable data on hours worked. One can spin these results either pro or con.
• • •
Missing some Tweet in this thread? You can try to
force a refresh