Last nights NPHET upload included 4 now deleted slides illustrating that as vaccine is rolled out Ireland will remain vulnerable to significant surges in cases, the worst projection being more than Dec/Jan wave, peaking at over 10k per day. They assume vax complete by October /1
Slides are headed 'A Vulnerable period ahead' & illustrate a possibility of repeated surges & lockdowns, assuming 58,800 vaccinations per week. 85% efficacy green line has just two future surges & lockdowns, another (0 efficacy?) just repeats /2
The most alarming one where R value is assumed to rise to 2 has a surge so enormous it vanishes off the top of the graph as it passed 10,000 cases. Looks to be a peak around 18k. Presumably these are 'look lads, despite vaccination you can still really feck this up' warning /3
There are a couple more - a 'case by mode of transmission' shows the way the (deliberate - this was a money saving decision) under resourcing of public health led to increasing cases over running ability to contact trace in both October & December & that this situation remains /4
A hospital acquired infections slide shows that these cases accounted for perhaps 20-30% of the hospitalisations in the January surge. A bit of a conspiracy theory has emerged suggesting that most hospitalisation were really hospital acquired, this wasn't the case /5
Likewise this death by settings slides refutes another conspiracy theory that most of those dying were terminally ill hospital patients - the blue bar which would be the absolute maximum as it includes all hospital acquired looks to be 10% of the total /6
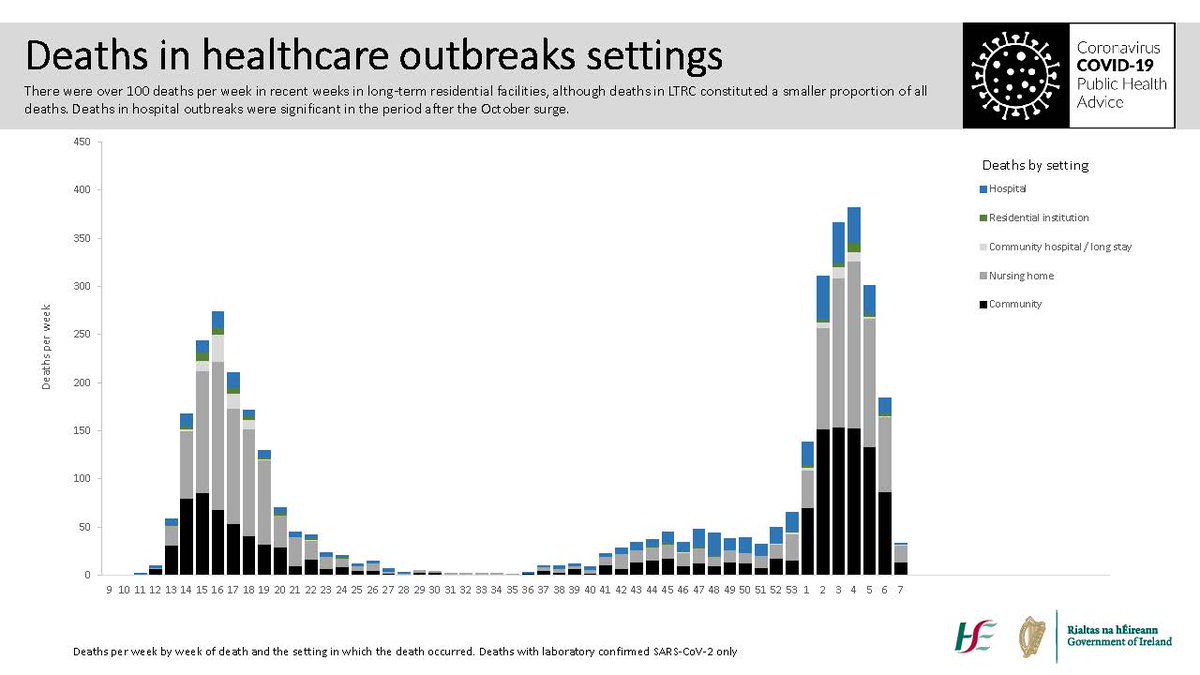
I would presume these were slides for the cabinet sub committee ahead of the NPHET press event that got uploaded by error after it. I'd much sooner this level of detail be available to the public, a better collective understanding of the virus leads to stronger solidarity /7
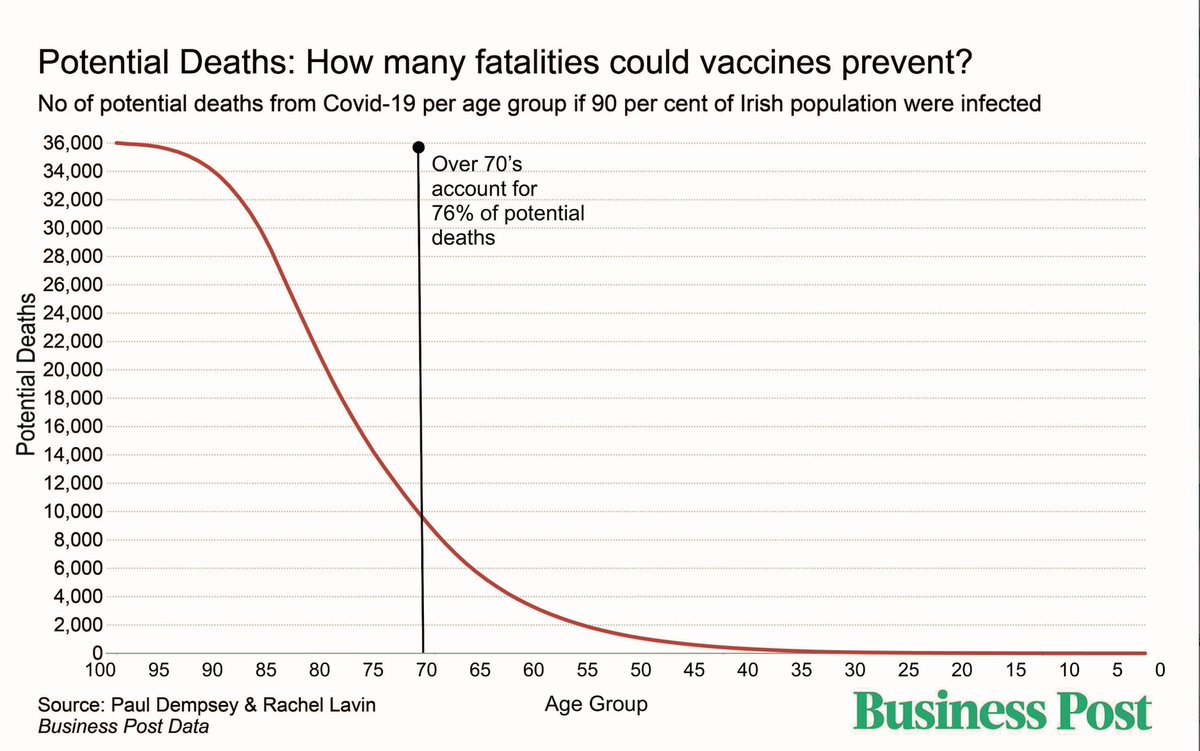
The vulnerable period ahead caught my eye because I am concerned by the threat of lobbyists demanding a premature opening on the assumption that the virus can't cause carnage once over 65s are vaccinated. This is not the case

• • •

Missing some Tweet in this thread? You can try to force a refresh
 

Keep Current with Andrew Flood 👨🏻‍💻📝🕺

Andrew Flood 👨🏻‍💻📝🕺 Profile picture

Stay in touch and get notified when new unrolls are available from this author!

Read all threads

This Thread may be Removed Anytime!

PDF

Twitter may remove this content at anytime! Save it as PDF for later use!

Try unrolling a thread yourself!

how to unroll video
  1. Follow @ThreadReaderApp to mention us!

  2. From a Twitter thread mention us with a keyword "unroll"
@threadreaderapp unroll

Practice here first or read more on our help page!

More from @andrewflood

19 Feb
836 positive #Covid19Ireland swabs which is 85% of last Friday. Positivity below 5% for first time in a while at 4.9%. Still looking at a very long (3 months) reduction in cases to get us under 100 per day /1
Average positive #Covid19 swabs over last 3 days was 863, thats 88% of same days last week, that rate projected
760 wk1
669 wk2
588 wk3
518 wk4
456 wk5
401 wk6
353 wk7
311 wk8
273 wk9
241 wk10
212 wk11
186 wk12
164wk13
/2
Drastic reduction in rate new cases falling at now attributed to rising proportion of #B117 - 90% of cases in last two weeks. Older variants reduced 35%+ a week, B117 reducing at around 15%, thats difference between 2 month lockdown & 5 month lockdown to get under 100 a day /3
Read 9 tweets
19 Feb
Weekly deaths bulletin for northern Ireland has 2691 #Covid19Ireland deaths to February 12th. This weekly NISRA count is more exhaustive that the Department of Health daily announcements & running total. It had 1985 deaths at that date, 26% less /1
The future NISRA minimum number of total deaths for yesterdays can be reprojected by adding the 36 DoH deaths since Feb 12th to the 2691 NISRA total for the 12th to give 2727. The likely total is 2706 which is 1454 #Coronavirus deaths per million in northern Ireland /2
NISRA provide a calculation of excess deaths (those above the 5 year average) which is 2,475 since the start of the pandemic, 546 of those in 2021. Worth noting in passing this is a higher ratio than the CSO in the south which may reflect south capturing more covid deaths? /3
Read 6 tweets
18 Feb
816 #CovidIreland positive swabs are 95% of last Thursday so very slow rate of reduction continues which means under 100 cases a day is month away. #B117 variant seems to be cause of slowdown with 25% of close contacts being infected now as against 12%. 5.26% positivity /1
Average of 842 positive swabs over last 3 days, this is 91% of same days last week. Week on week reductions at that rate runs into June to go under 100
766 wk1
698 wk2
635 wk3
579 wk4
527 wk5
480 wk6
437 wk7
398 wk8
362 wk9
330 wk10
300 wk11
273 wk12
249
/2
HSE report of number of close contacts of confirmed cases remains pretty static so this isn't the cause of the slowing down but a much higher proportion of these now test positive probably due to B117. Note NPHET give a lower adult only figure on Thursday evening /3
Read 5 tweets
17 Feb
938 positive swabs, up[ ass usual on Tuesday but 86% of last Wednesday, continuing the pattern of very much reduced rate of decrease. Positivity at 5.5% slight improvement on yesterday but still too high. At this rate 14 weeks to get under 100 a day /1 Image
Average positive swabs of last 3 days is 785, 87% of the same days last week. At that week on week rate
686 wk1
600 wk2
525 wk3
459 wk4
401 wk5
351 wk6
307 wk7
268 wk8
235 wk9
205 wk10
179 wk11
157 wk12
137wk13 - 19th May
/2
This rate of decrease is again similar to that of Northern Ireland which for the last couple of weeks has also had a very similar 7 day incidence rate - perhaps for once we won't be in a situation with radically difference rates each side of the border /3
Read 8 tweets
20 Jan
Increase in positive swabs (2791) to be expected on Weds & anticipated in Mondays GP referrals. Tues to Weds last week saw day to day 160% increase, this is 156% so comparable. This is also a 2.4% increase in positivity to 11.5%, last week it was a 2.5% increase /1
2791 is 71% of last Weds figure but averaging over 3 days we have 2128 swabs with a reduction of 68% on equivalent days last week which same as yesterday gets us under 100 cases a day 8 weeks from now on March 17th. So no big change in pattern despite apparent one day rise /2
That weekly 3 day average reduction sequence now looks like
1449 - Jan27
986 - Feb3
672 - F10
457 - F17
311 - F24
212 - March3
144 - M10
98 - M17
67
46
31
21
Read 6 tweets
20 Jan
Post this lockdown we are going to again be faced with a lobbyist demand for careless rushed opening based this time on the idea that IFR will have fallen because those most at risk have been vaccinated. This sounds sensible but is another recipe for disaster /1
Core problem is that over half those who were hospitalised were under 65 & about 60% of those who went into ICU. The 6k cases a day peak in January exhausted ICU capacity, forcing cancellation of routine surgery & turning operating theatres into surge ICU. /2 ht @1987Andrewk
161 under 65s had died to December, stats on ICU admission to that date suggest that without such access for 385 who needed it 2 to 3 times as many would have died. 2768 needed hospitalisation from those ages, presumably without access many (50%) would also have died. /3
Read 10 tweets

Did Thread Reader help you today?

Support us! We are indie developers!


This site is made by just two indie developers on a laptop doing marketing, support and development! Read more about the story.

Become a Premium Member ($3/month or $30/year) and get exclusive features!

Become Premium

Too expensive? Make a small donation by buying us coffee ($5) or help with server cost ($10)

Donate via Paypal Become our Patreon

Thank you for your support!

Follow Us on Twitter!