@ProfMattFox 1/
The odds ratio from a case-control study is an unbiased estimator of the

a. odds ratio in the underlying cohort when we sample controls among non-cases

b. rate ratio in the underlying cohort when we use with incidence density sampling

No rare outcome assumption required.
@ProfMattFox 2/
Because the odds ratio is approximately equal to the risk ratio when the outcome is rare, the odds ratio from a case-control study approximates the risk ratio in the underlying cohort when we sample controls among non-cases and the outcome is rare.

But...
@ProfMattFox 3/
... for an unbiased estimator of the risk ratio (regardless of the outcome being rare), we need a case-base design, not a classical case-control design.

Of course, all of the above only applies to time-fixed treatments or exposures.

As for the causal interpretation...
@ProfMattFox 4/
If there is confounding, selection bias, or measurement bias in the underlying cohort, the same applies to the case-control.

For example, if we need to adjust for selection bias due to loss to follow-up in the cohort, we also need to adjust for it in the case-control study.
@ProfMattFox 5/
For more realistic applications of case-control studies with time-varying treatments, see the paper led by @barbradickerman on #TargetTrial emulation with case-control designs:


Or sign up for her upcoming talk on this topic:

• • •

Missing some Tweet in this thread? You can try to force a refresh
 

Keep Current with Miguel Hernán

Miguel Hernán Profile picture

Stay in touch and get notified when new unrolls are available from this author!

Read all threads

This Thread may be Removed Anytime!

PDF

Twitter may remove this content at anytime! Save it as PDF for later use!

Try unrolling a thread yourself!

how to unroll video
  1. Follow @ThreadReaderApp to mention us!

  2. From a Twitter thread mention us with a keyword "unroll"
@threadreaderapp unroll

Practice here first or read more on our help page!

More from @_MiguelHernan

5 Mar
1/
We recently confirmed the effectiveness of the Pfizer-BioNTech vaccine outside of randomized trials @NEJM.
nejm.org/doi/full/10.10…

Studies like ours are being used to promote a vaccine passport to travel in the US, UK, and European Union.

A few clarifications are in order.
2/
Before we start, a disclaimer:

Vaccine passports involve complex ethical, economic, and political considerations.

Here I talk exclusively about scientific issues. The goal is that those making decisions have a better understanding of what we do and do not know as of today.
3/
Based on our study, we can say confidently that the vaccine is highly effective in preventing you from getting sick with #COVID19.

Based on our study, we can't say confidently that the vaccine is highly effective in preventing you from getting infected and infecting others.
Read 9 tweets
24 Feb
1/
We've just confirmed the effectiveness of the Pfizer-BioNTech vaccine outside of randomized trials.

Details @NEJM: nejm.org/doi/full/10.10…

Yes, great news, but let's talk about methodological issues that arise when using #observational data to estimate vaccine effectiveness.
2/
A critical concern in observational studies of vaccine effectiveness is #confounding:

Suppose that people who get vaccinated have, on average, a lower risk of infection/disease than those who don't get vaccinated.

Then, even if the vaccine were useless, it'd look beneficial.
3/
To adjust for confounding:

We start by identifying potential confounders.

For example: Age
(vaccination campaigns prioritize older people and older people are more likely to develop severe disease)

Then we choose a valid adjustment method. In our paper, we matched on age.
Read 12 tweets
27 Nov 20
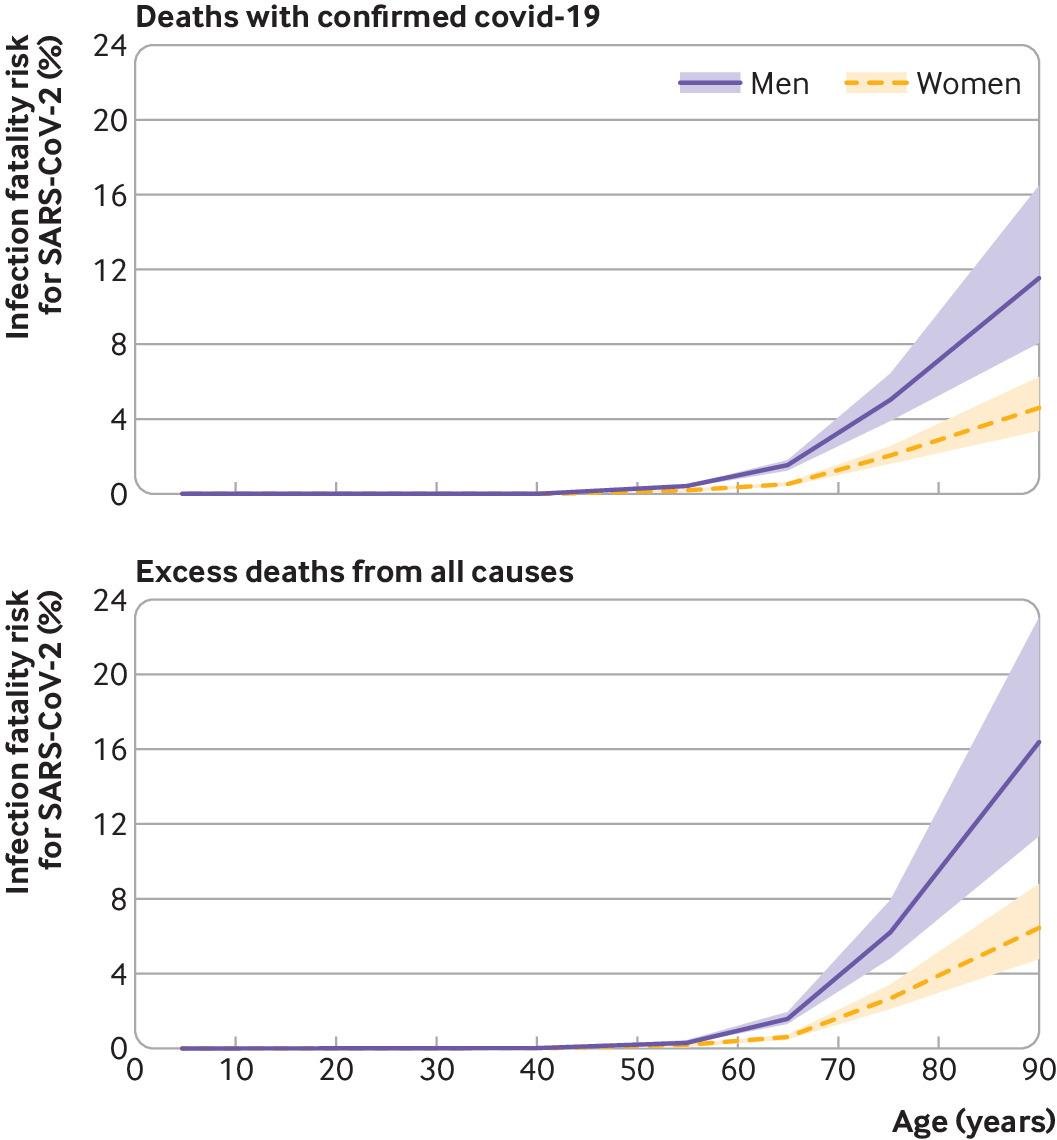
1/ Estimating the infection fatality risk (IFR) of #SARSCoV2 is hard.

Our estimates from Spain's #ENECOVID (just published):
Men: 1.1% to 1.4%
Women: 0.58% to 0.77%

After age 80
Men: 12% to 16%
Women: 4.6% to 6.5%

Why is the #IFR hard to estimate?
bmj.com/content/371/bm…
2/ The IFR in a population is the ratio of

number of deaths from SARS-CoV-2 infection (numerator)

and

number of individuals infected by SARS-CoV-2 (denominator)

during a prespecified period.

Both numerator and denominator are hard to quantify.
3/ Why is the denominator hard to quantify?

The number of infected with #SARSCoV2 is not the number of confirmed #COVID19 cases.

Because many infected individuals never have symptoms or have minor symptoms and are never diagnosed.

(For details, see journals.plos.org/plosntds/artic…)
Read 6 tweets
13 Nov 20
1/ Madrid es la única gran ciudad europea con más del 100% de sus camas de UCI en hospitales públicos ocupadas por enfermos con #COVID19

DURANTE DOS MESES.

Mantener este nivel de ocupación de UCIs es jugar con fuego.

Image
2/ Porque:

Se reasignan a UCI camas que se deberían usar para otras enfermedades.

Se agota al personal de UCI que debe atender a más pacientes.

Si la epidemia resurge, no queda capacidad de respuesta.

Las UCIs son nuestra última línea defensa.
3/ ¿Cómo se llegó a esto?

El primer problema fue permitir una epidemia increíblemente descontrolada durante tanto tiempo.

Otros países han tomado medidas mucho más duras cuando su nivel de ocupación de UCIs llegaba al 40%, el punto al que llego Madrid a finales de agosto.
Read 6 tweets
23 Sep 20
1/
Ayer el 36% de UCIs de Madrid estaban ocupadas por enfermos con #COVID19, según cifras oficiales.
elpais.com/sociedad/2020-…

Incorrecto.

Ayer el 95% de UCIs de Madrid estaban ocupadas por COVID-19 (112% en hospitales públicos).


¿Por qué la discrepancia?
2/
Porque las cifras oficiales cuentan como UCI cualquier cama donde se puede instalar un respirador:
quirófanos, salas reanimación postquirúrgica, unidad coronaria, UCI pediátrica...

Y no cuentan que el 70-75% de UCIs de verdad suelen están ocupadas en periodos no pandémicos.
3/
Así que el número de personas ingresadas en UCI por #COVID19 en Madrid es mayor que el número de camas reales de UCI en cada hospital.

Por ejemplo:

"La Paz" tiene 30 camas de UCI y 31 ingresados por COVID-19

"12 de Octubre" tiene 24 camas de UCI y 34
ingresados pr COVID-19
Read 8 tweets
11 Sep 20
1/
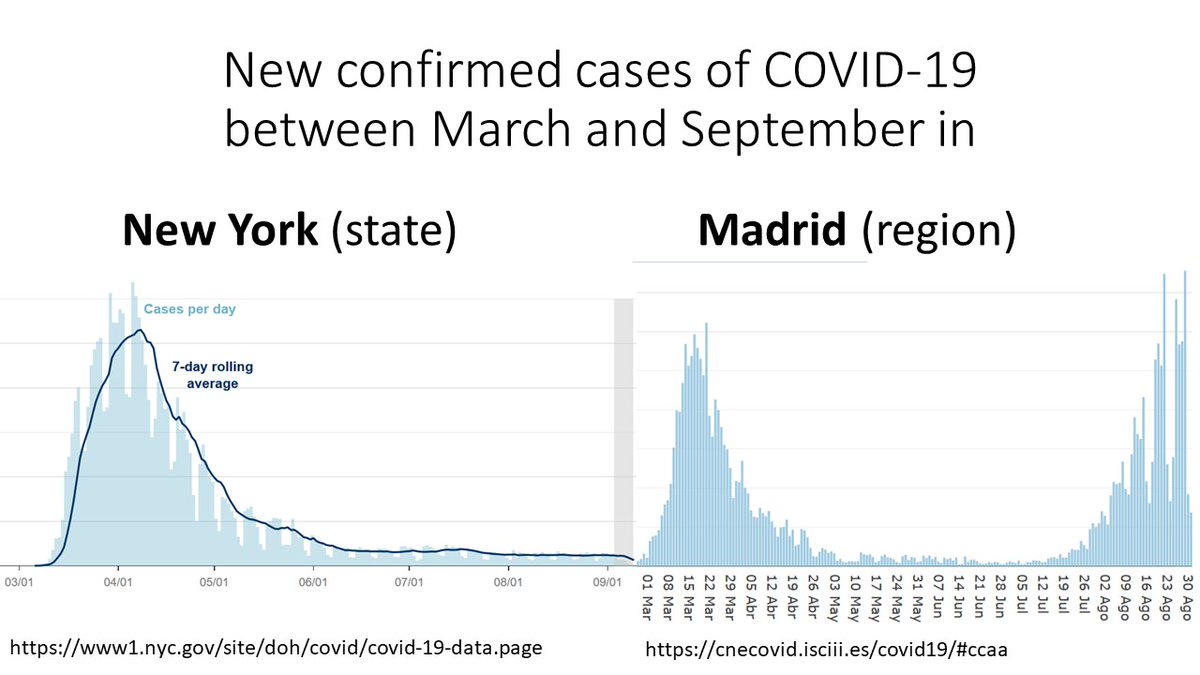
Look at the shape of these curves.

New York and Madrid had similar epidemics until they spectacularly diverged.

In March, both cities were caught by surprise and shut down because of #COVID19.

In September, the situation is under control in NY and alarming in Madrid.

Why? Image
2/
Let’s start with the similarities: two big, dense cities with a large network of public transit and lots of visitors.

An explosive outbreak of #SARSCOV2 overwhelmed their contact tracing system and their hospitals. A lockdown was required to reduce the public health disaster.
3/
By June, both places had succeeded in bringing down the number of new cases. That's precisely what lockdowns do.

In July, new cases started to increase in Madrid until reaching one of the highest incidences in Europe.

New York has not seen any increase in new cases yet.
Read 15 tweets

Did Thread Reader help you today?

Support us! We are indie developers!


This site is made by just two indie developers on a laptop doing marketing, support and development! Read more about the story.

Become a Premium Member ($3/month or $30/year) and get exclusive features!

Become Premium

Too expensive? Make a small donation by buying us coffee ($5) or help with server cost ($10)

Donate via Paypal Become our Patreon

Thank you for your support!

Follow Us on Twitter!