1/
We've just confirmed the effectiveness of the Pfizer-BioNTech vaccine outside of randomized trials.
Details @NEJM: nejm.org/doi/full/10.10…
Yes, great news, but let's talk about methodological issues that arise when using #observational data to estimate vaccine effectiveness.
We've just confirmed the effectiveness of the Pfizer-BioNTech vaccine outside of randomized trials.
Details @NEJM: nejm.org/doi/full/10.10…
Yes, great news, but let's talk about methodological issues that arise when using #observational data to estimate vaccine effectiveness.
2/
A critical concern in observational studies of vaccine effectiveness is #confounding:
Suppose that people who get vaccinated have, on average, a lower risk of infection/disease than those who don't get vaccinated.
Then, even if the vaccine were useless, it'd look beneficial.
A critical concern in observational studies of vaccine effectiveness is #confounding:
Suppose that people who get vaccinated have, on average, a lower risk of infection/disease than those who don't get vaccinated.
Then, even if the vaccine were useless, it'd look beneficial.
3/
To adjust for confounding:
We start by identifying potential confounders.
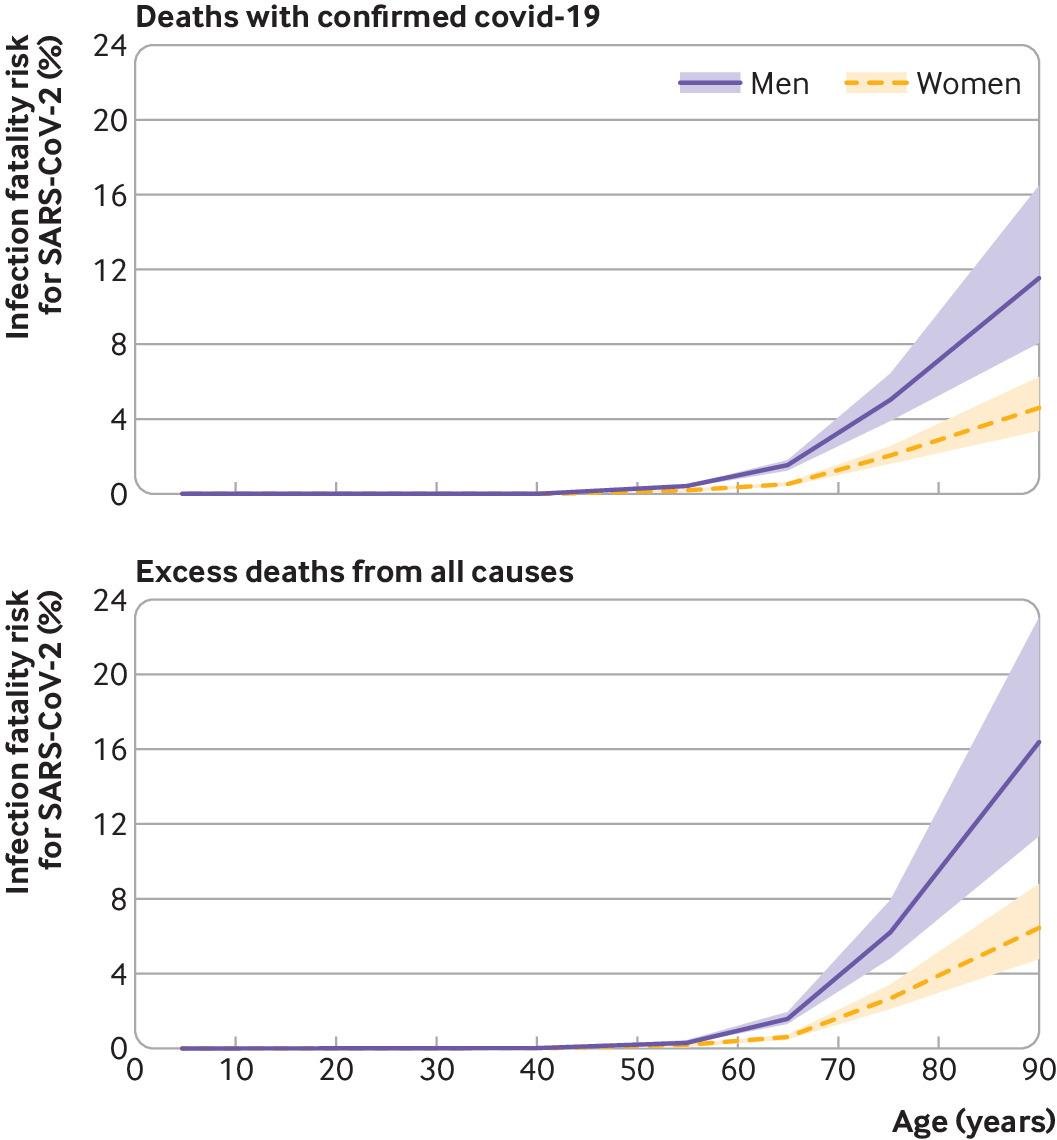
For example: Age
(vaccination campaigns prioritize older people and older people are more likely to develop severe disease)
Then we choose a valid adjustment method. In our paper, we matched on age.
To adjust for confounding:
We start by identifying potential confounders.
For example: Age
(vaccination campaigns prioritize older people and older people are more likely to develop severe disease)
Then we choose a valid adjustment method. In our paper, we matched on age.
4/
After age adjustment, how do we know if there is residual confounding?
Here is one way to go about that:
We know from the previous randomized trial that the vaccine has no effect in the first few days.
So we check whether matching on age suffices to replicate that finding.
After age adjustment, how do we know if there is residual confounding?
Here is one way to go about that:
We know from the previous randomized trial that the vaccine has no effect in the first few days.
So we check whether matching on age suffices to replicate that finding.
5/
No, it doesn't.
After matching on age (and sex), the curves of infection start to diverge from day 0, which indicates that the vaccinated had a lower risk of infection than the unvaccinated.
Conclusion: adjustment for age and sex is insufficient.
nejm.org/doi/suppl/10.1…
No, it doesn't.
After matching on age (and sex), the curves of infection start to diverge from day 0, which indicates that the vaccinated had a lower risk of infection than the unvaccinated.
Conclusion: adjustment for age and sex is insufficient.
nejm.org/doi/suppl/10.1…

6/
We learned that we had to match on other #COVID19 risk factors, e.g., location, comorbidities, healthcare use...
And we could do so with high-quality data from @ClalitResearch, part of a health services organization that covers >50% of the Israeli population.
As an example,
We learned that we had to match on other #COVID19 risk factors, e.g., location, comorbidities, healthcare use...
And we could do so with high-quality data from @ClalitResearch, part of a health services organization that covers >50% of the Israeli population.
As an example,
7/
A vaccinated 76 year-old Arab male from a specific neighborhood who received 4 influenza vaccines in the last 5 years and had 2 comorbidities was matched with an unvaccinated Arab male from the same neighborhood, aged 76-77, with 3-4 influenza vaccines and 2 comorbidities.
A vaccinated 76 year-old Arab male from a specific neighborhood who received 4 influenza vaccines in the last 5 years and had 2 comorbidities was matched with an unvaccinated Arab male from the same neighborhood, aged 76-77, with 3-4 influenza vaccines and 2 comorbidities.
8/
After matching on all those risk factors, the curves of infection start to diverge after day ~12, as expected if the vaccinated and the unvaccinated had a comparable risk of infection.
Using this "negative control", we provide evidence against large residual confounding.
After matching on all those risk factors, the curves of infection start to diverge after day ~12, as expected if the vaccinated and the unvaccinated had a comparable risk of infection.
Using this "negative control", we provide evidence against large residual confounding.

9/
This is a good illustration of how #randomized trials and #observational studies complement each other for better and more efficient #causalinference.
First, a randomized trial is conducted to estimate the effectiveness of the vaccine to prevent symptomatic infection, but...
This is a good illustration of how #randomized trials and #observational studies complement each other for better and more efficient #causalinference.
First, a randomized trial is conducted to estimate the effectiveness of the vaccine to prevent symptomatic infection, but...
10/
... the trial's estimates for severe disease and specific age groups are imprecise.
Second, an observational analysis emulates a #targettrial (an order of magnitude greater) and confirms the vaccine's effectiveness on severe disease and in different age groups.
However...
... the trial's estimates for severe disease and specific age groups are imprecise.
Second, an observational analysis emulates a #targettrial (an order of magnitude greater) and confirms the vaccine's effectiveness on severe disease and in different age groups.
However...
11/
... the observational study needs the trial's findings as a #benchmark to guide the data analysis and strengthen the quality of the #causalinference.
Randomized trials & Observational studies working together. The best of both worlds.
Let's keep doing it after the pandemic
... the observational study needs the trial's findings as a #benchmark to guide the data analysis and strengthen the quality of the #causalinference.
Randomized trials & Observational studies working together. The best of both worlds.
Let's keep doing it after the pandemic
12/
What a luxury having been able to think about these issues with my colleagues Noa Dagan, @noambard, @mlipsitch, Ben Reis, and @RanBalicer
We hope that our experience is helpful for researchers around the world who use observational data to estimate #vaccine effectiveness.
What a luxury having been able to think about these issues with my colleagues Noa Dagan, @noambard, @mlipsitch, Ben Reis, and @RanBalicer
We hope that our experience is helpful for researchers around the world who use observational data to estimate #vaccine effectiveness.
• • •
Missing some Tweet in this thread? You can try to
force a refresh