1. Trading a Rejection candle : One of the most enjoyable pattern to trade is a Rejection candle. I say enjoyable because it has a higher probability of success playing contrarian to the market. And who doesn't like to play contrarian and win. #TheWittyOptionsClass
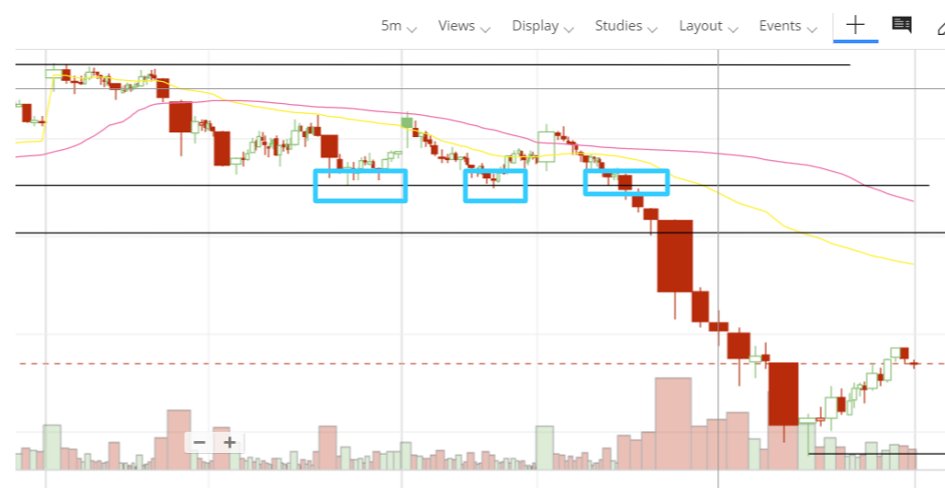
2. The typical setup is something like the one shown in the below chart:
A rejection candle appearing almost at day high, followed by a red candle is a high probability short.
3. Stoploss in such trade would be the high made on the rejection candle.
If Market comes back and takes away that stop, it would mean the market is not really in a mood to go down. Remember, I called it a High-probability short, and not a sureshot short. #TheWittyOptionsClass
4. In case of a range bound market, we see a lot of rejections on both sides. This signifies that the traders have been unable to make up their mind and both the bears and bulls are fighting to take control of the market. #TheWittyOptionsClass
5. Below is the banknifty futures chart for 26th march 2021, when the index kept oscillating between a range as perfectly as it ever can be. #TheWittyOptionsClass
6. However, the day was accompanied with sharp fall in Ivs, which led to fall in both calls and puts - a perfect day for Option Sellers (Short straddles, strangles, Iron fly, Iron condor etc.)
7. Look at the price decay that happened on the same day for 34000CE option. Someone writing this particular contract could have shorted after the first rejection candle with the top of the rejection candle as his stoploss. #TheWittyOptionsClass
8. However, given the sharp fall after the first rejection candle, stoploss would have been quite broad and thus, to take this particular short, one would be advised to reduce his position size to comply with his daily max loss potential limit. #TheWittyOptionsClass
9. Remember, "High Probability" means a higher chance of something happening as expected. But it also means, a lower chance of something unexpected happening. We put stoploss and reduce positions to save ourselves in case the low probability event occurs. #TheWittyOptionsClass
10. Finally, Such ranges, when broken, lead to sharp movements and attract major trend followers. #TheWittyOptionsClass
• • •
Missing some Tweet in this thread? You can try to
force a refresh
1. Thread on CONDITIONAL BUY:
Purpose is to catch trending moves once it is confirmed.
Plot the most important support and resistance on the chart such that violating those levels will lead to a trending move in all likelihood. #OptionsTrading#markets
2. Eg. Banknifty is at 36000. Support at 35500 and Resistance at 36500.
Place buy orders in the system such that 35500PE is bought if 35500 is violated.
36500CE is bought if 36500 is breached.
3. What should be the limit price order for the two contracts (35500PE, 36500CE)?
Ideally, the price of an ATM contract should be same keeping everything else constant ( Days to expiry, volatility, interest rates etc.) #OptionsTrading#markets
1. If you are reluctant to commit to any uptrend, (or for that matter even in a downtrend), yet, have to create a position, then consider bullish butterfly as your go to strategy.
Below is an example I have created for #bhartiairtel
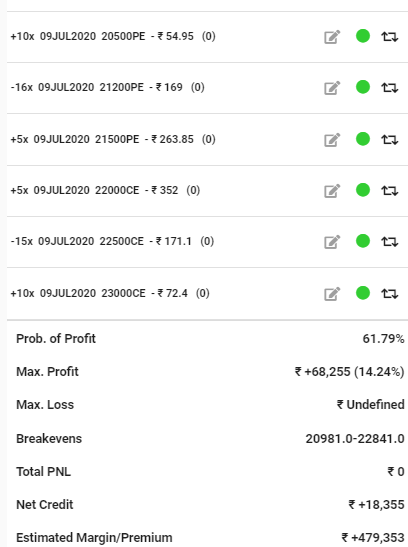
2. Attached are the positions deployed:
3. Benefits:
a. Low capital requirement (1.3L)
b. Risk limited (~4k)
c. High Max profit potential (32.8K)
Chart is strong but has rallied alot. View is it would find strong resistance around 500 but may not fall much.
Is there any other strategy you think can be used here?
1."Conditional Buy"
Aim is to capture theta on a day to day basis by selling straddles/strangles.
Instead of putting stops on the sold arms, close contracts are bought to convert naked arms into bull/bear debit spreads if the index is breaking away from a range. #OptionsTrading
2. Sharing my strategy as I execute it. At around 9:30 AM, I would assess probable demand and supply zones on #banknifty chart. Breach of these zones would lead to quick price movements, which may or may not result in a trend. #OptionsTrading
3. Now I choose the nearest 500 strike to write a strangle. Eg. #Banknifty closed at 29631 on Friday, 27th Nov. So I would be writing 29000PE and 30000CE Weekly contracts.
a. 29000 PE premium: 184
b. 30000 CE premium: 246
c. Total Premium collected per lot : 430 #OptionsTrading
1. If there was any doubt about how important Options charts are.. today was the day that removed it.
Below is #BANKNIFTYFUTURE chart on 5-min time frame.
The first line of support for Banknifty futures was around 22130. It bounced off that zone multiple times yesterday.
2. Then today even after a gap up, the rally got sold into and took support around the same levels and bounced back.
However the fat 12:10 candle was the last attempt by bulls to breakout of the zone. But there was no followup and it was back again at 22130 levels.
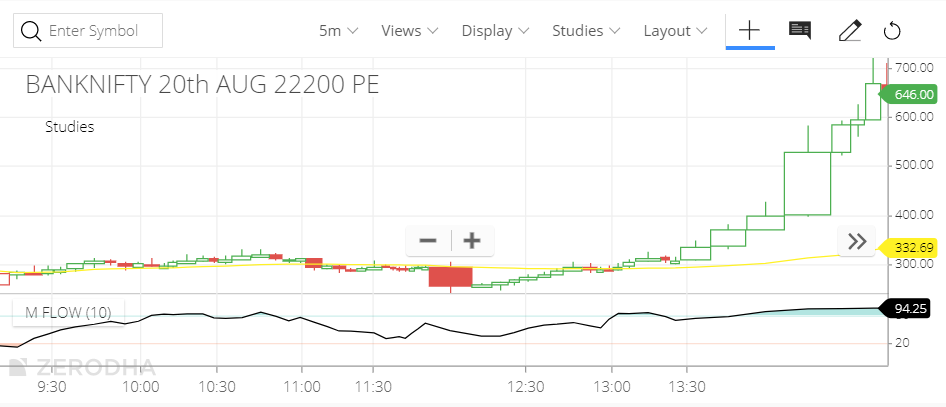
3. I was tracking the 20th Aug Expiry 22200 CE-PE contracts since morning and even with BNF gapping up, along with IV sliding lower by upto 2%, the ATM Put was not going below VWAP in any meaningful manner. This was the show of strength. #banknifty#bankniftyoption
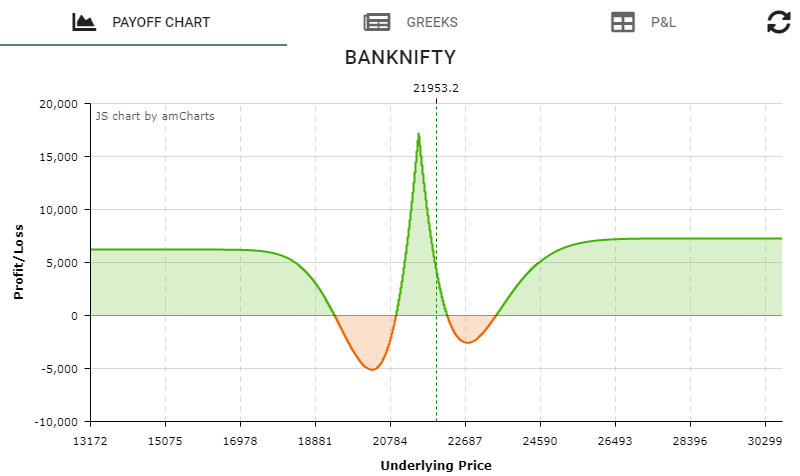
1. #Banknifty Strategy : Here, I have created a weekly strategy which is high on time decay and has negative vega. Given vega has been falling off significantly in the past few days. Hoping the trend to continue. Bias is positive in weekly.
2. As the market rallied hard last week and used last hours of Thursday and whole of Friday to consolidate without giving up crucial zone of 21800 completely,there is a good likelihood of it attempting the recent highs again in the coming week.Thats an assumption I am working on.
3. Hence the weekly has a positive delta. However, if the rally has to resume, the fall in volatility/Vega may continue. Thats why it makes more sense to write more, buy less. Hence theta is positive. Gamma would need to be tackled if there is a fresh breakout of sorts.
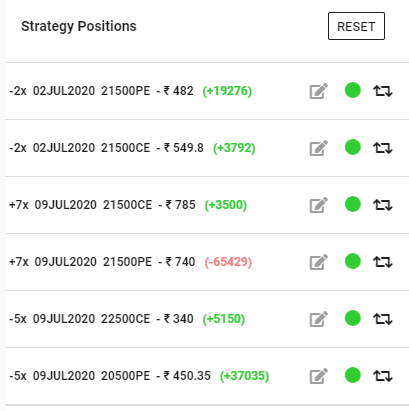
Decent Week. Decent Gains. Sharing my #Banknifty strategy for learning purpose. The below positions and P&L are only for reference. Actual trades were done in my account, but would not share actual P&L Screenshots here.
2. What you see here is a Double Calendar Spread modified to follow trend of the market. If the market is non-trending and stays within 0.5 sigma (standard deviation), it gains due to positive #theta or time-decay. If the market is trending on one side, #gamma gets active.
3. I should have captured initial #Greek positions also, that would have given a good perspective on how the strategy was planned. Will do it next time.