NEW Data Update on USMortality.com
CDC had skipped last week, now find mortality data up to week 12, 3/20 on the site!
Highlights:
1) Week 9-11 no more significant excess.
2) Ages 25-74 still very high substantial excess
3) 85+ dipped below the normal
#Covid19
1/n
CDC had skipped last week, now find mortality data up to week 12, 3/20 on the site!
Highlights:
1) Week 9-11 no more significant excess.
2) Ages 25-74 still very high substantial excess
3) 85+ dipped below the normal
#Covid19
1/n
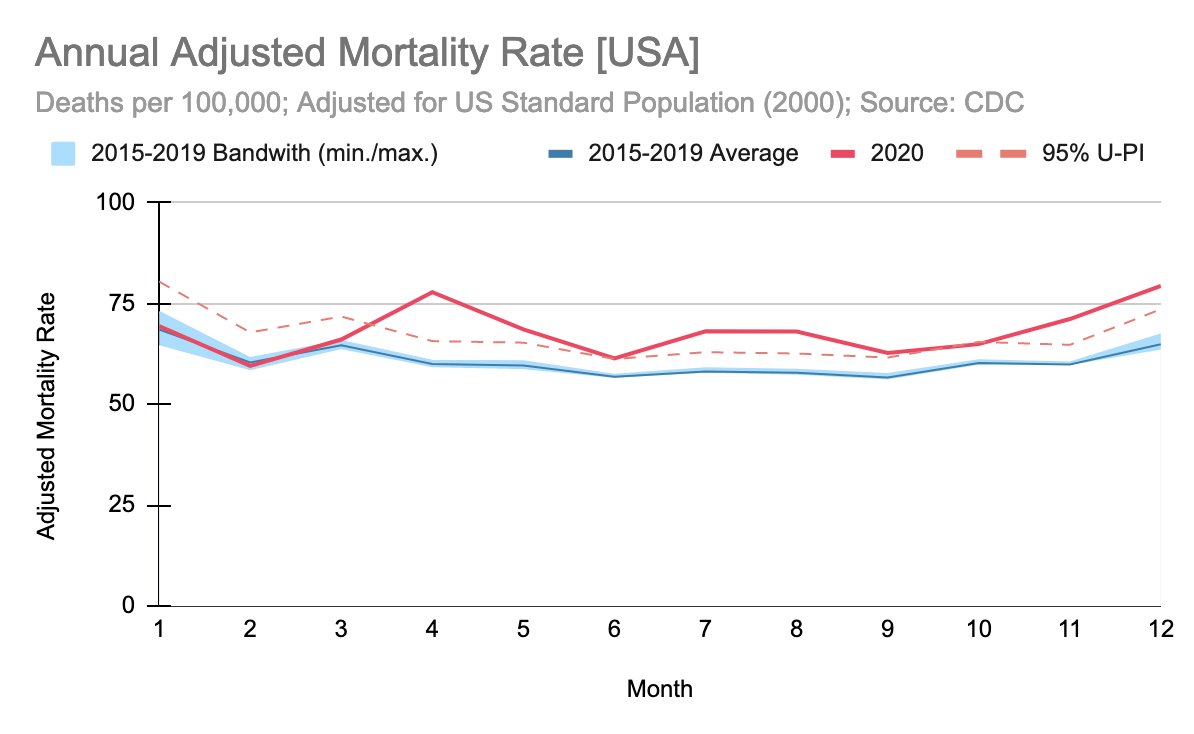
1) Aggregated over all age groups, in week 9-11 it dipped below the "Substantial Increase" threshold (4x stddv) for the first time, since the start of the pandemic.
Last week is still very uncertain, as less than 60% of data in...
2/n
Last week is still very uncertain, as less than 60% of data in...
2/n

2) <25 Never had any significant excess during the pandemic, proofing that the young are unaffected by the virus, but likely very affected by the measures.
Middle age groups remain very high - despite vaccine rollout. I suspect that there are many lockdown deaths included.
3/n
Middle age groups remain very high - despite vaccine rollout. I suspect that there are many lockdown deaths included.
3/n

3) The 65 year age group which should have had access to the vaccine now since a while, not doing much better than e.g. in week 37/2020 - still at the same high excess level of 7x stddv excess.
Two highest age groups are good - with 85+ even having submortality. DryTinder?
4/n
Two highest age groups are good - with 85+ even having submortality. DryTinder?
4/n

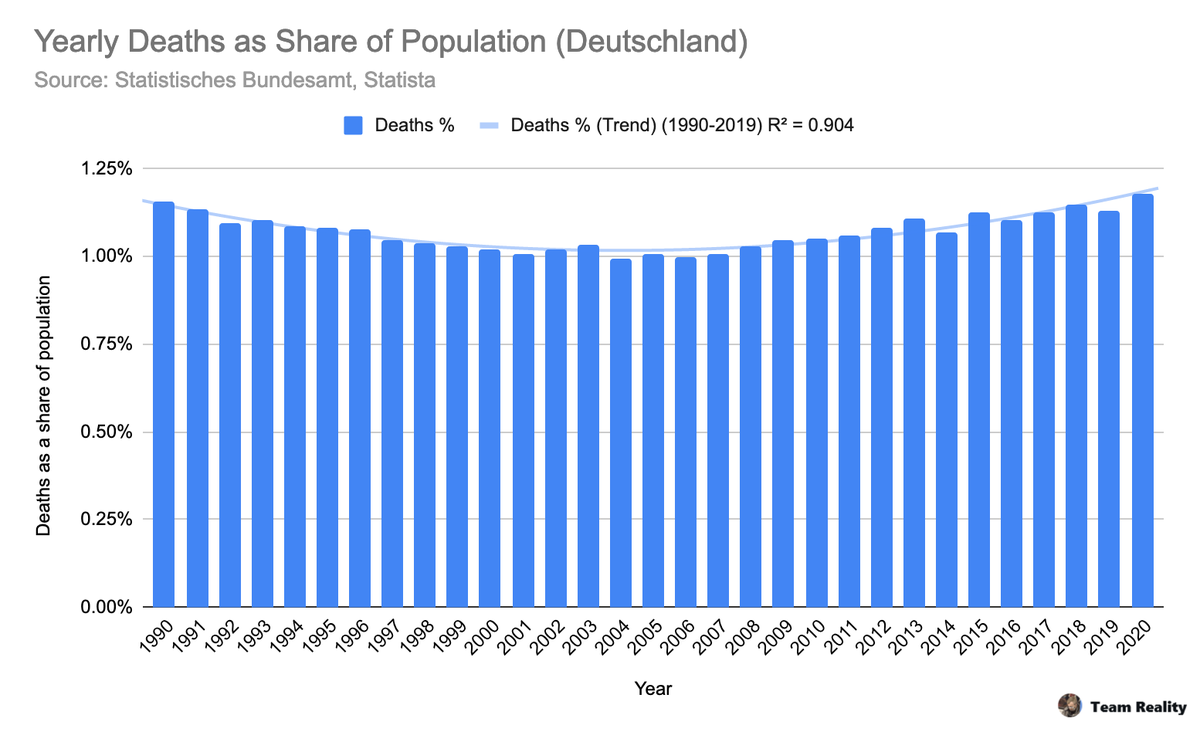
Excess Mortality!
2020 Reported: 3,437,019 deaths. Expected deaths were 3,042,412. Increase of 394,607 deaths (13.0%).
2021 Reported: 868,845 deaths. Expected deaths thus far, were 745,959. Increase of 122,886 deaths (16.5%).
5/n
2020 Reported: 3,437,019 deaths. Expected deaths were 3,042,412. Increase of 394,607 deaths (13.0%).
2021 Reported: 868,845 deaths. Expected deaths thus far, were 745,959. Increase of 122,886 deaths (16.5%).
5/n

Finally let's look at some maps!
Find all charts & maps on USMortality.com!
#Covid19 #Covid #Corona #coronavirus
@AlexBerenson @naomirwolf @FatEmperor @NikkiHaley @kerpen @RobertKennedyJr @govkristinoem @GovRonDeSantis @ilDonaldoTrumpo
6/6
Find all charts & maps on USMortality.com!
#Covid19 #Covid #Corona #coronavirus
@AlexBerenson @naomirwolf @FatEmperor @NikkiHaley @kerpen @RobertKennedyJr @govkristinoem @GovRonDeSantis @ilDonaldoTrumpo
6/6


• • •
Missing some Tweet in this thread? You can try to
force a refresh