Trevor Bedford Profile picture
26 Apr, 10 tweets, 4 min read
There are effectively two #COVID19 epidemics in the US at this moment; one largely resolving epidemic comprised of non-variant viruses and one growing epidemic of B.1.1.7. Together they have resulted in a near-plateau of cases throughout much of the spring. 1/10
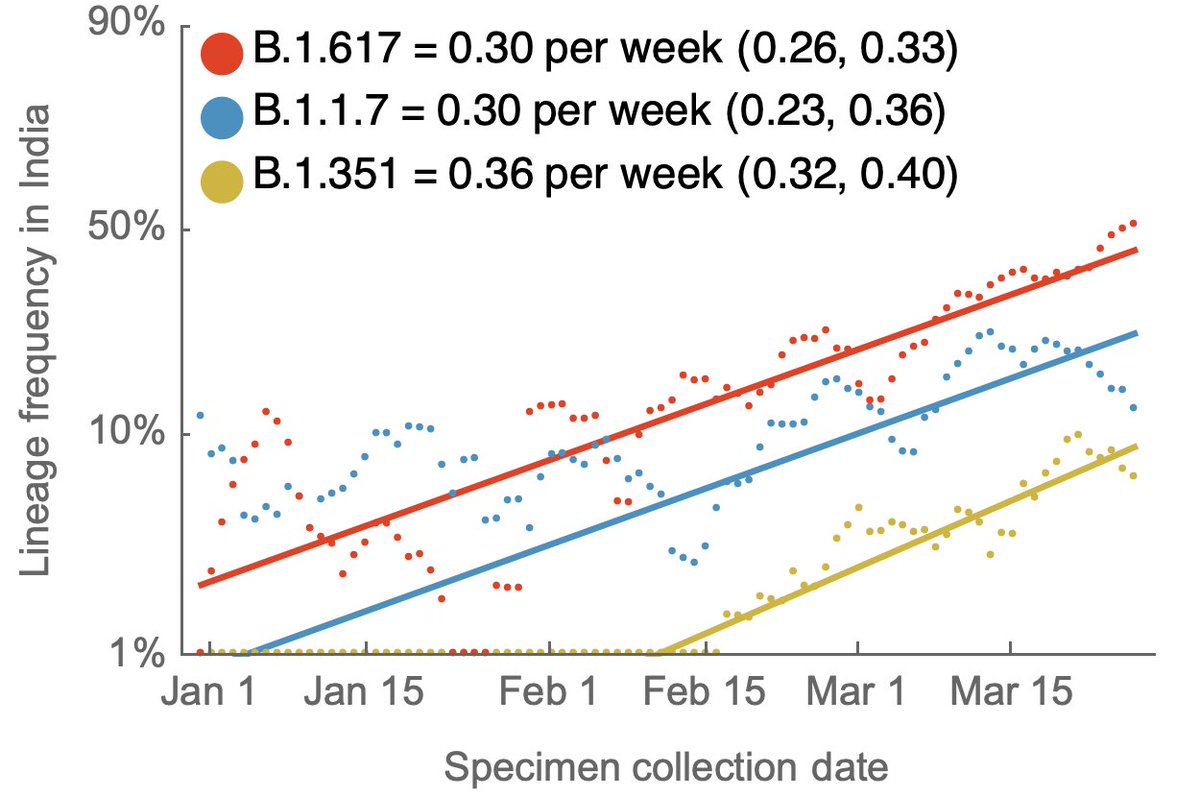
If we look at virus frequencies in the US using data in @GISAID, we can see that the 7-day weighted frequency of B.1.1.7 has been growing consistently since January and is now over 50% in the US. 2/10
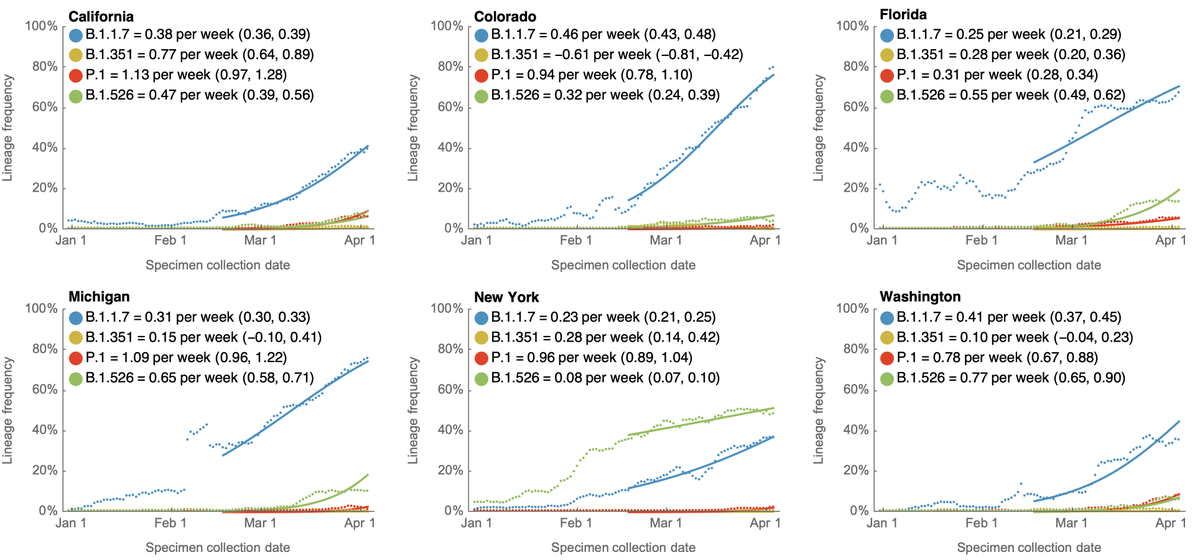
This pattern is repeated across individual states. These six were chosen as states with plentiful genomic data and to provide geographic diversity. B.1.1.7 is dominating throughout the US, except for New York and surroundings where B.1.526 is co-circulating. 3/10
We can use the estimated frequency of B.1.1.7 to split cases reported by @CDCGov (data.cdc.gov/Case-Surveilla…) into non-B.1.1.7 cases and B.1.1.7 cases. In the following I've applied a 7-day smoothing to case trajectories. 4/10
This is showing B.1.1.7 cases in blue stacked on top of non-B.1.1.7 cases in gray, where it's clear that non-B.1.1.7 cases have continued to decline, while B.1.1.7 cases have continued to increase. 5/10
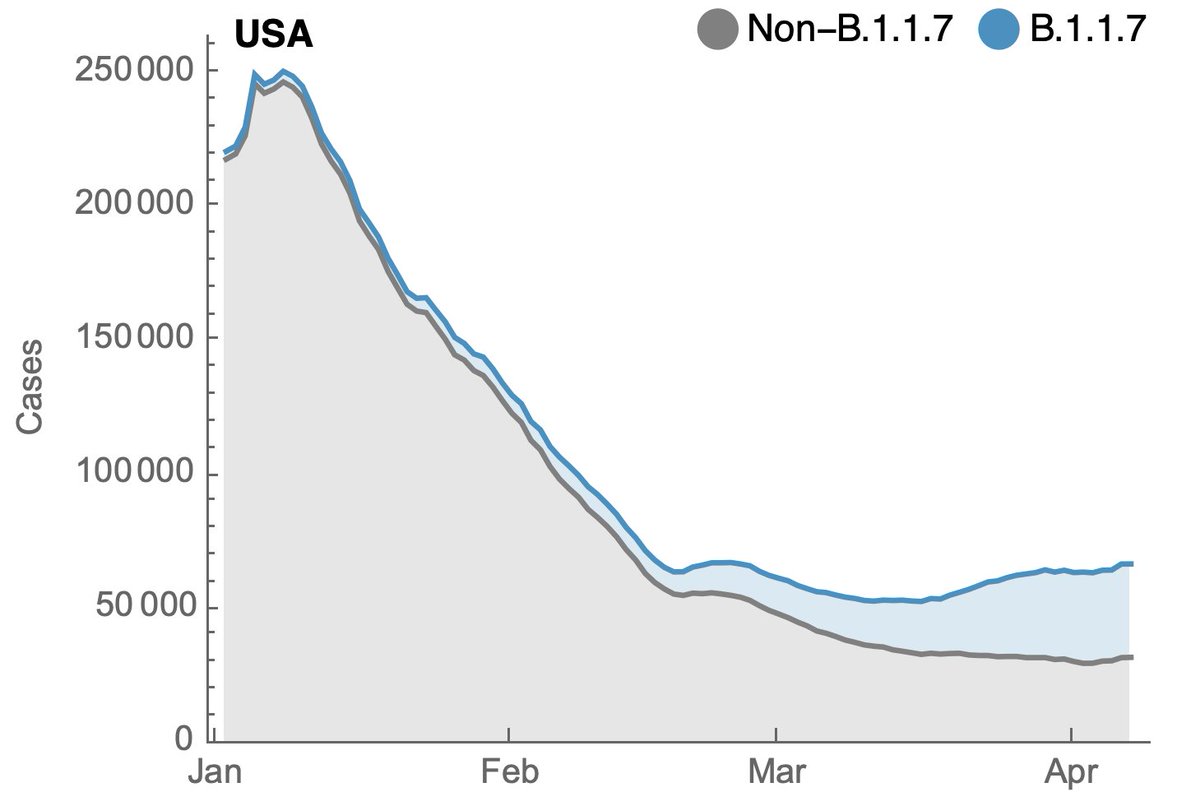
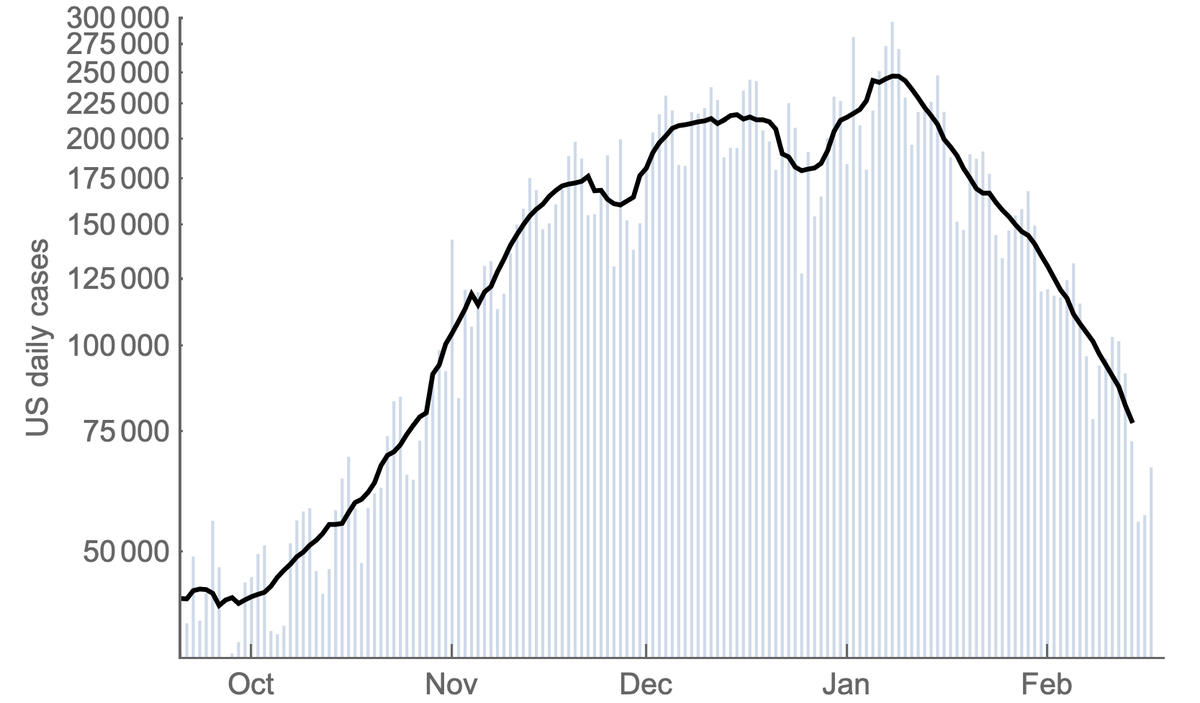
Plotting each on a log scale makes growth and decline more obvious. Without the contribution of B.1.1.7 there would have been ~32k cases on April 7 rather than the observed ~65k cases. 6/10
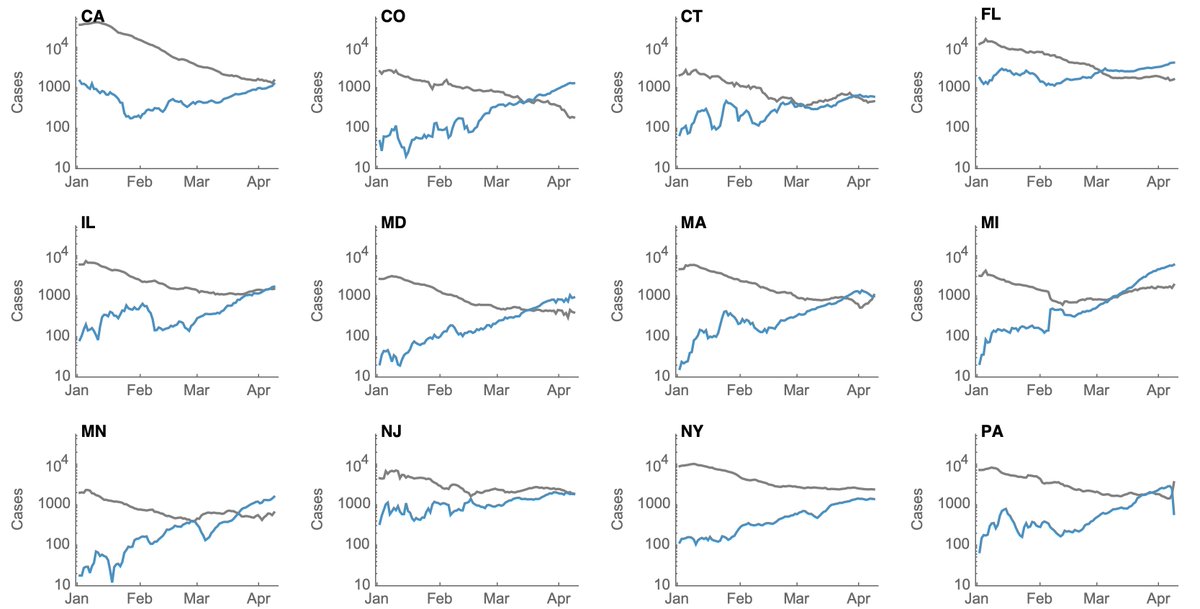
We can see the same pattern repeated in individual states with growing B.1.1.7 epidemics on top of a largely resolving non-B.1.1.7 background. Some states like California have less of a B.1.1.7 epidemic and some like Colorado and Michigan have more of a B.1.1.7 epidemic. 7/10
Again, plotting non-B.1.1.7 cases (in gray) and B.1.1.7 cases (in blue) on a log scale makes the separation of growth and decline more obvious. 8/10
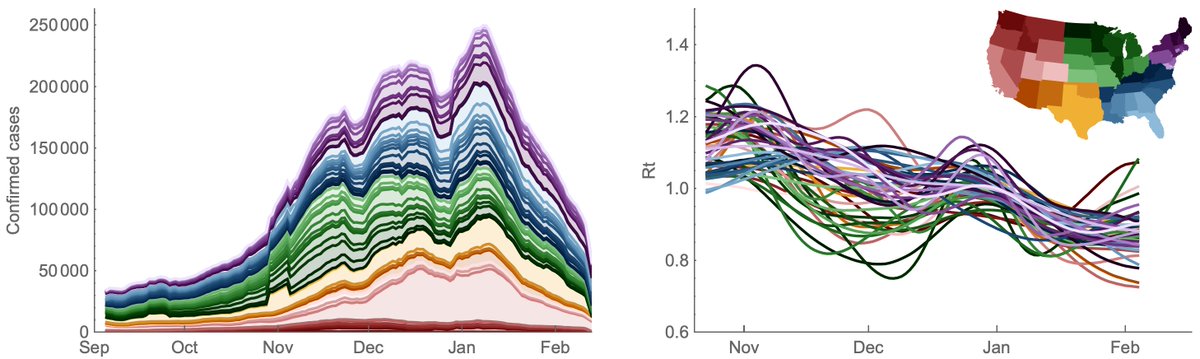
This is consistent with what's been seen in the UK and in Europe and supports a transmission advantage of B.1.1.7. Thus we see that the same conditions that can lead to control of older non-B.1.1.7 viruses and Rt < 1, can still result in growth of B.1.1.7 and Rt > 1. 9/10
That said, there are multiple factors that should be resulting in continued improvements to the US COVID-19 epidemic (vaccination, continued build up of natural immunity from infection, improved seasonality). It's unclear to me how much of a wave from B.1.1.7 to expect. 10/10

• • •

Missing some Tweet in this thread? You can try to force a refresh
 

Keep Current with Trevor Bedford

Trevor Bedford Profile picture

Stay in touch and get notified when new unrolls are available from this author!

Read all threads

This Thread may be Removed Anytime!

PDF

Twitter may remove this content at anytime! Save it as PDF for later use!

Try unrolling a thread yourself!

how to unroll video
  1. Follow @ThreadReaderApp to mention us!

  2. From a Twitter thread mention us with a keyword "unroll"
@threadreaderapp unroll

Practice here first or read more on our help page!

More from @trvrb

23 Apr
It's hard for me to infer the degree to which new variants are driving the surge in cases in India, but we are seeing rapid growth in frequency of multiple viral variants. 1/5
Here is a @nextstrain view of @GISAID data that focuses on viruses from India and highlights emerging lineages B.1.1.7 (in blue), B.1.351 (in green) and B.1.617 (in orange). Interactive version at nextstrain.org/ncov/asia?c=em…. 2/5
We can fit a logistic growth model to the full genomic dataset from India for these three lineages, where we see logistic growth as "linear on a logit scale". Each of these lineages is estimated to have similar logistic growth rates of ~0.3 per week. 3/5
Read 5 tweets
23 Apr
When variants of concern were first identified in late Dec, the US was not where it needed to be in terms of genomic surveillance. However, with considerable ramp up by the CDC, state labs and academic groups, we now have a remarkable genomic surveillance system. 1/14
My favorite metric for genomic surveillance is the number of cases that have been sampled, sequenced and shared publicly to @GISAID in the previous 30 days. By incorporating both sequencing volume and turnaround time, it tells you how much is known about current circulation. 2/14
Throughout the fall, the US had just 100-300 genomes available that were sampled, sequenced and shared in the previous 30 days. 3/14
Read 14 tweets
14 Apr
Since their recognition in the UK, South Africa and Brazil in Dec 2020 and Jan 2021, the variant of concern lineages B.1.1.7, B.1.351 and P.1 have continued to spread throughout the world with B.1.1.7 so far the most successful of the three. 1/15
These lineages first received attention due to large numbers of mutations to the spike protein along with rapid increases in frequency in the UK, South Africa and Manaus, Brazil, but much subsequent attention has focused on key mutations E484K and N501Y. 2/15
This figure shows genotype at sites 484 and 501 mapped onto a reference phylogeny of ~4k viruses sampled from all over the world with 484K viruses in light orange, 501Y viruses in blue (including B.1.1.7) and 484K+501Y viruses in dark orange (including B.1.351 and P.1). 3/15
Read 16 tweets
18 Feb
After a ~2 month plateau from mid-Nov to mid-Jan, the US #COVID19 epidemic has undergone a steady week after week decline and is now back to daily case counts last seen in late October. A thread on what we might expect going forwards. 1/13
Working with case counts from @COVID19Tracking and Rt estimates from epiforecasts.io, I'm showing US confirmed cases broken out by state alongside transmission rate as measured by Rt through time. 2/13
Generally, Rt > 1 in Nov and Dec corresponding to rising cases and drops below 1 in Jan corresponding to falling cases. We've seen a steady decline in Rt from Nov to Feb. Thus, current decline is not a sudden shift in circumstance, but resulted from reaching Rt < 1. 3/13
Read 13 tweets
3 Feb
With emerging variants of SARS-CoV-2 and initial evidence of antigenic evolution, I've seen comparisons here to seasonal influenza and its rate of evolution. In this thread, I want to ground these comparisons with some data. 1/18
If we follow a transmission chain of SARS-CoV-2 from person to person, we'll generally see one mutation occur across the viral genome roughly every two weeks. 2/18
Here I use data from @nextstrain and @GISAID to compare sampling date to the number of mutations across the SARS-CoV-2 genome relative to initial genomes from Wuhan. This shows a steady accumulation of mutations through time with the average virus now bearing ~24 mutations. 3/18 Image
Read 19 tweets
20 Jan
Important new study by Wibmer et al (biorxiv.org/content/10.110…) of neutralization by convalescent sera on wildtype vs 501Y.V2 variant viruses circulating in South Africa. It shows that mutations present in 501Y.V2 result in reduced neutralization capacity. 1/10
Here, I've replotted data from the preprint to make effect size a bit more clear. Each line is sera from one individual tested against wildtype virus on the left and 501Y.V2 variant virus on the right. Note the log y axis (as is common with this type of data). 2/10
It's clear that 501Y.V2 often results in reductions of neutralization titer, quantified as "fold-reduction" where, for example, a 2-fold reduction in titer would mean that you need twice as much sera to neutralize the same amount of virus in the assay. 3/10
Read 10 tweets

Did Thread Reader help you today?

Support us! We are indie developers!


This site is made by just two indie developers on a laptop doing marketing, support and development! Read more about the story.

Become a Premium Member ($3/month or $30/year) and get exclusive features!

Become Premium

Too expensive? Make a small donation by buying us coffee ($5) or help with server cost ($10)

Donate via Paypal Become our Patreon

Thank you for your support!

Follow Us on Twitter!