tej wiara:)
co nam pokaza wyniki sondazy z FB na temat koronasytuacji?
dane: covidmap.umd.edu, detale: ojs.ub.uni-konstanz.de/srm/article/vi…
koronadane z covid.ourworldindata.org
jedziemy!
#koronawirus #Polska #COVID19 #thread
(tu podobny watek dot. Francji:
1/n
co nam pokaza wyniki sondazy z FB na temat koronasytuacji?
dane: covidmap.umd.edu, detale: ojs.ub.uni-konstanz.de/srm/article/vi…
koronadane z covid.ourworldindata.org
jedziemy!
#koronawirus #Polska #COVID19 #thread
(tu podobny watek dot. Francji:
https://twitter.com/ChrisGodlak/status/1388545507363115009)
1/n
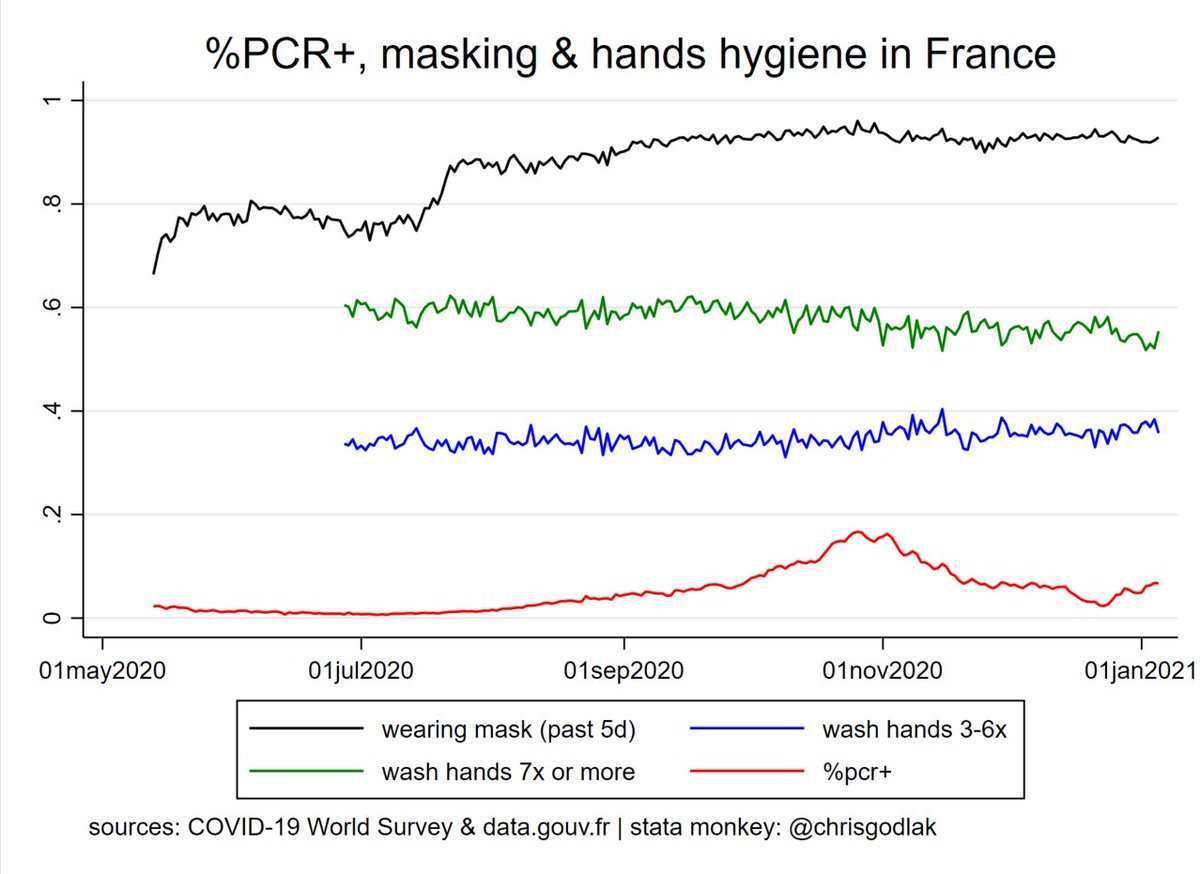
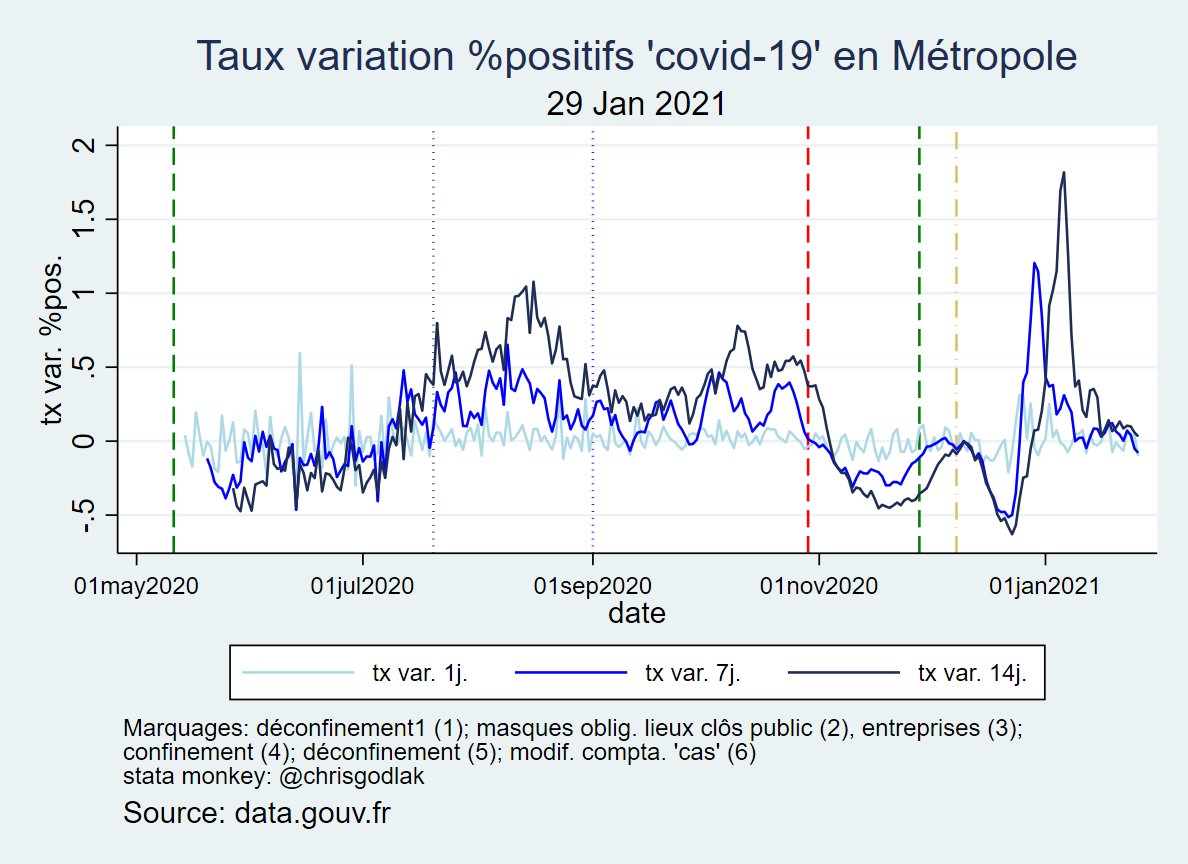
Mycie nog zycia wrog a maseczki i mycie rak przestaja dzialac na jesien/zime
kto by pomyslal :p
#koronawirus #Polska #COVID19
2/n
(chcesz wiecej => t.me/chrisgodlak)
kto by pomyslal :p
#koronawirus #Polska #COVID19
2/n
(chcesz wiecej => t.me/chrisgodlak)

to szczegolnie przestanie lazenia po barach knajpach itp powoduje wzrost %pcr+ na jesien zime jak widac ;)
#koronawirus #Polska #COVID19
3/n
(sprawdz mnie: t.me/chrisgodlak)
#koronawirus #Polska #COVID19
3/n
(sprawdz mnie: t.me/chrisgodlak)

tak samo jak przestanie hangowania sie z ludzmi itp. :D
#koronawirus #Polska #COVID19
4/n
(zapraszam: t.me/chrisgodlak)
#koronawirus #Polska #COVID19
4/n
(zapraszam: t.me/chrisgodlak)

c.d. zajoba: przestanie arbeitowania poza chata, uzywanie buroakowozow itp tez sprzyja %pcr+ na jesien / zime ;)
#koronawirus #Polska #COVID19
5/n
(ahoj: t.me/chrisgodlak)
#koronawirus #Polska #COVID19
5/n
(ahoj: t.me/chrisgodlak)

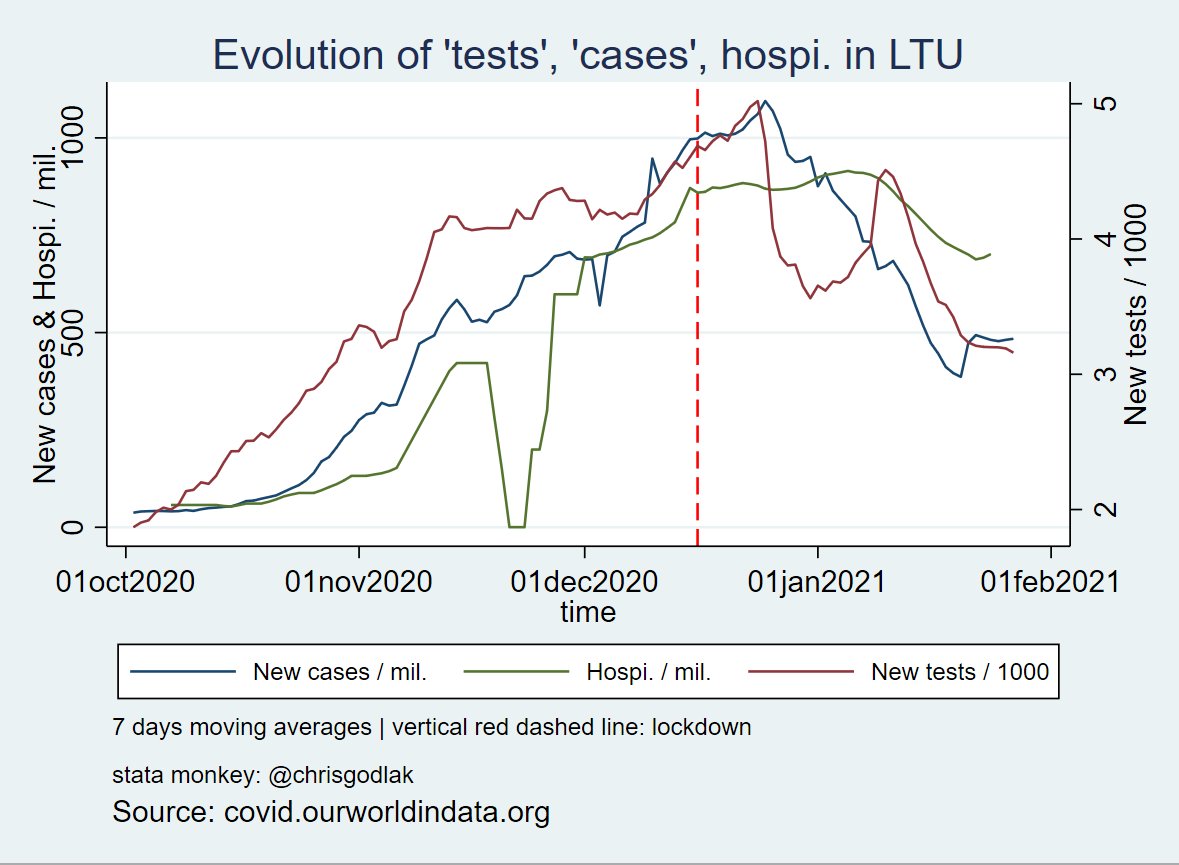
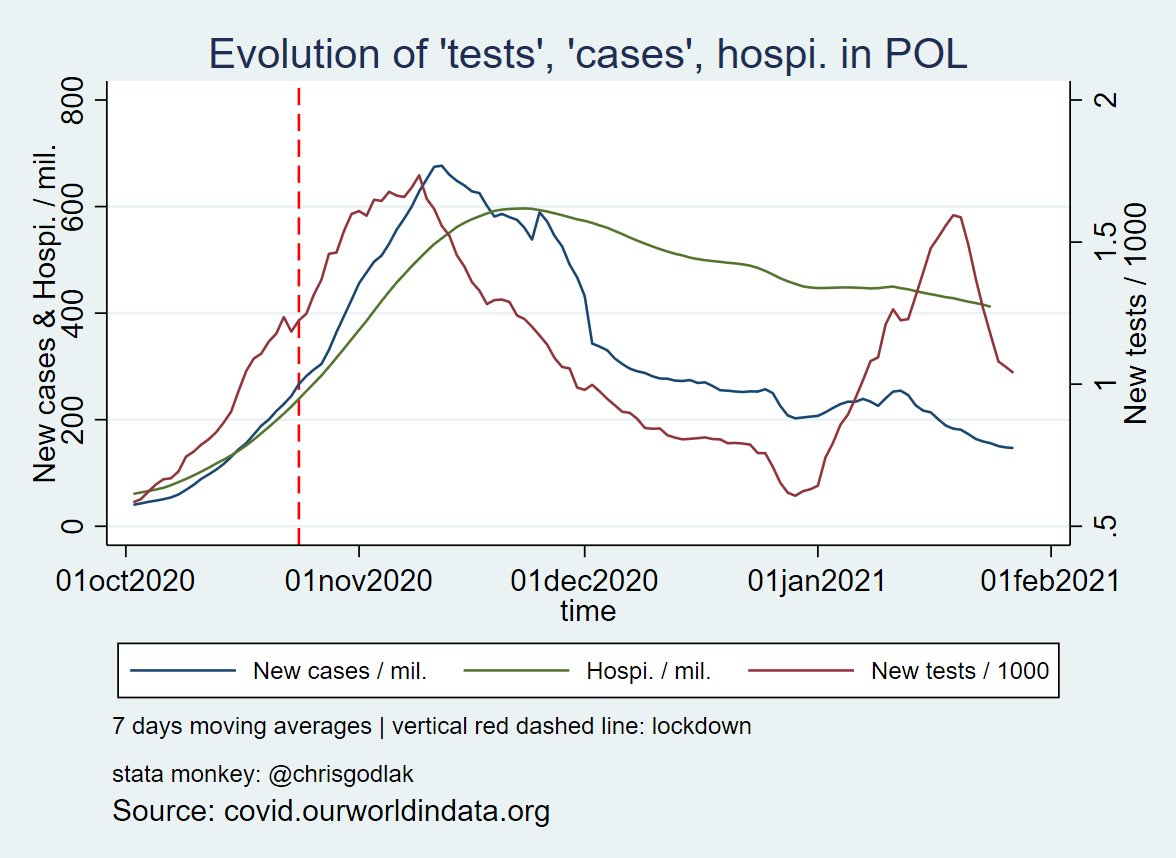
jak wiadomo lockdown sprzyja dobremu samopoczuciu !
#koronawirus #Polska #COVID19
6/n
(antydepresja: t.me/chrisgodlak)
#koronawirus #Polska #COVID19
6/n
(antydepresja: t.me/chrisgodlak)

najlepsze na koniec: fejsbukowcy znaja kogo kto kichnal akurat w sam raz na czas "fali" jesienno-zimowej ale sami nie dorwali ani kichniecia ani grypy (moze lekka anosmia na zimny sezon)
#koronawirus #Polska #COVID19
7/7
(t.me/chrisgodlak)
#koronawirus #Polska #COVID19
7/7
(t.me/chrisgodlak)

p.s. ta sa dane z FB users survey
tutaj sa lepsze teoretycznie dane z ankiet: …ics.imperialcollegehealthpartners.com/t/BDAU/views/Y… ale trzeba sie przez to przekopac... i nie ma narazie Polski...
pozdrawiam :)
@WojciechM
@marekjachowicz
@OrdoMedicus
@synxchaosu
@6_wilku
@_Jims4
@otwieramy
tutaj sa lepsze teoretycznie dane z ankiet: …ics.imperialcollegehealthpartners.com/t/BDAU/views/Y… ale trzeba sie przez to przekopac... i nie ma narazie Polski...
pozdrawiam :)
@WojciechM
@marekjachowicz
@OrdoMedicus
@synxchaosu
@6_wilku
@_Jims4
@otwieramy
• • •
Missing some Tweet in this thread? You can try to
force a refresh


