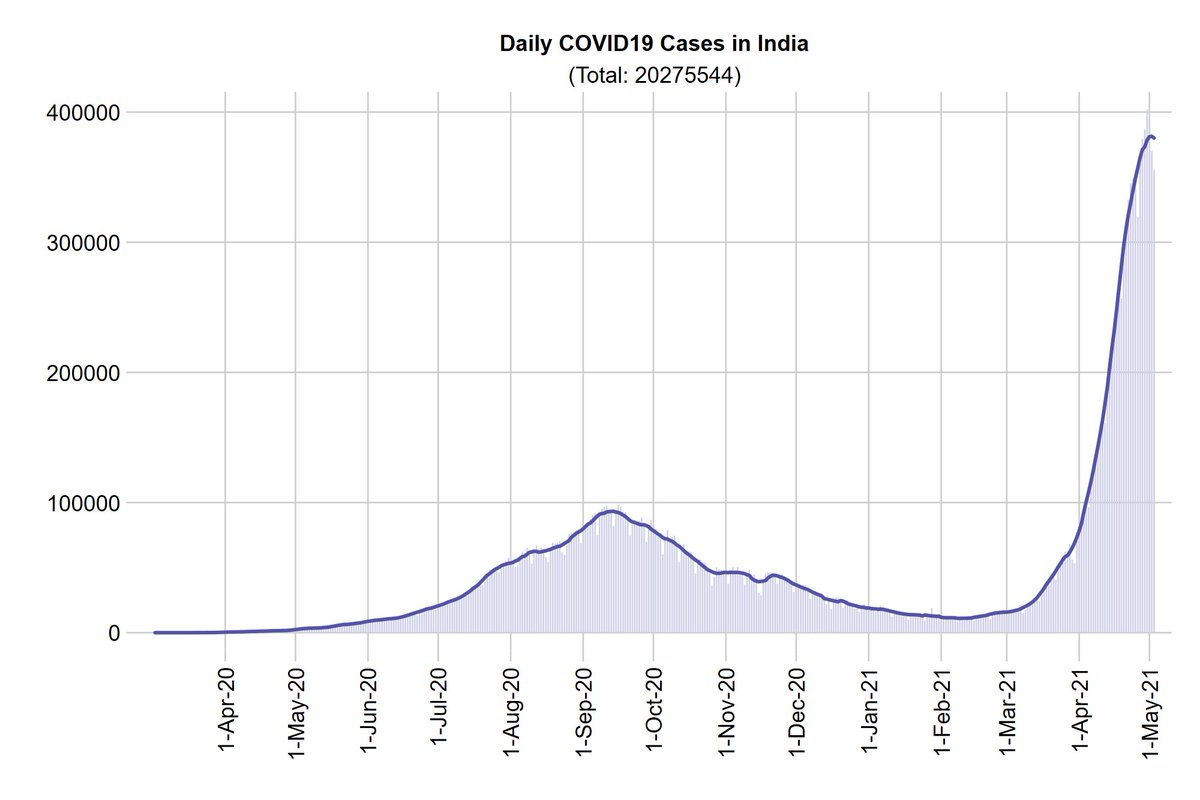
India's reported #COVID19 cases have crossed 2cr (20M)

The daily chart suggests a peak/plateau. However, this is NOT natural.

This 'peak' has followed reduced daily testing.

From a peak of 19.5L daily tests on Apr 30, our daily testing has been on a consistent decline!
1/4
Yesterday's daily testing was only 16.6L despite being a regular Monday!

It appears that we are forcing an artificial peak with reduced testing!

The consistent reduction in testing started just as we crossed 400K cases!

2/4
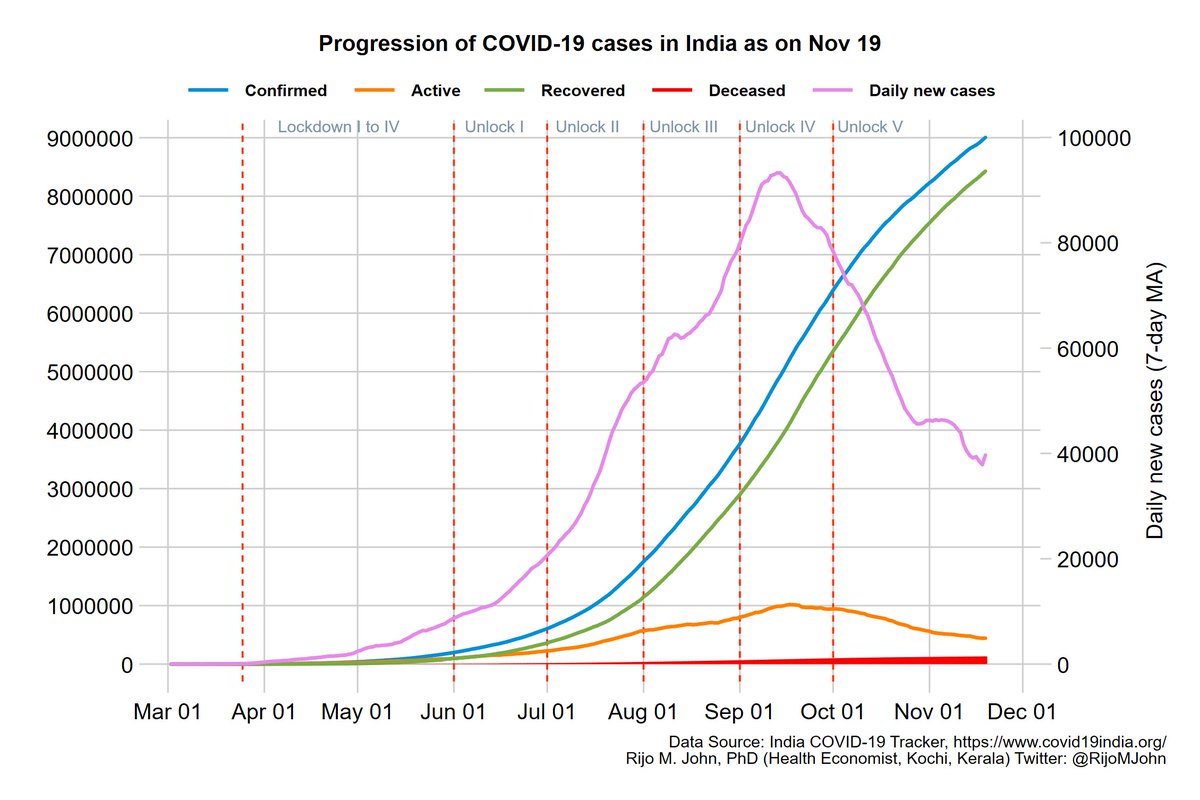
Something quite similar had happened during the previous peak last year too.

The day daily new cases touched 98K & everyone was expecting India to cross 1L daily cases, the daily testing began going down

Tests did go up after a gap of few days only to see reduced cases!

3/4
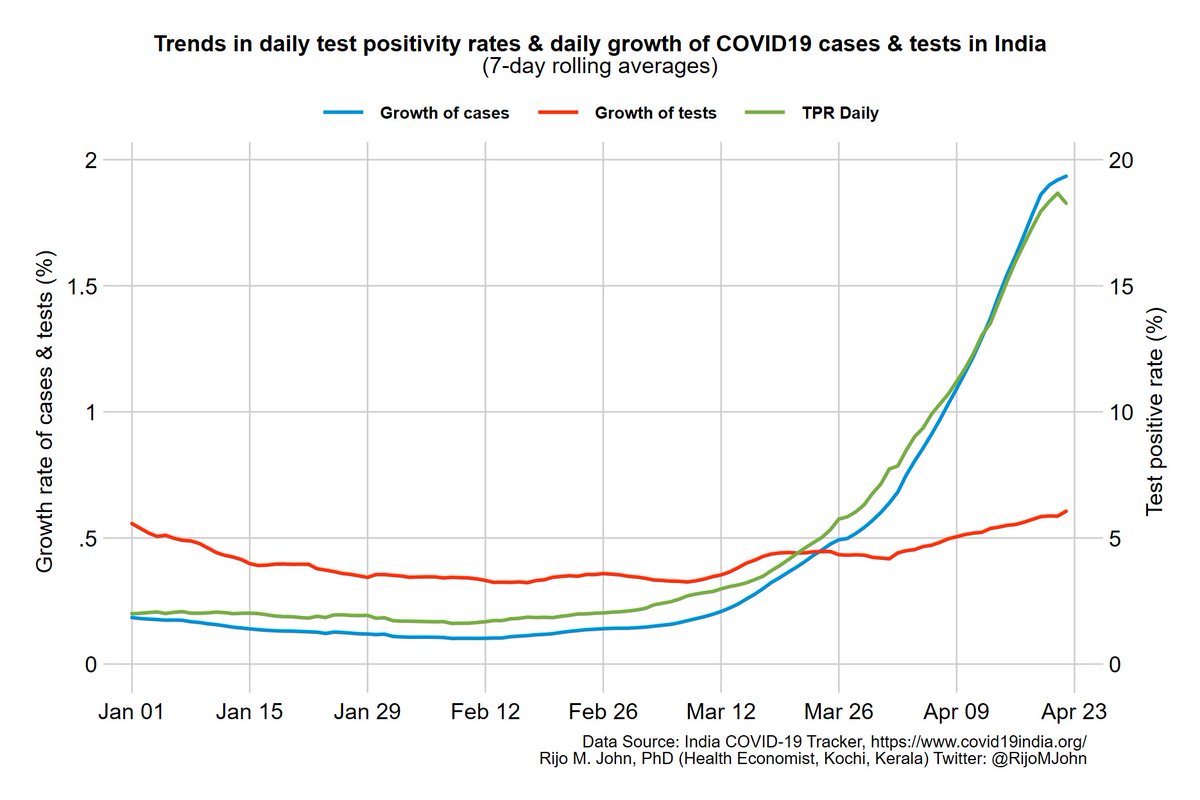
Currently, what's also intriguing is the timing of the decline in daily deaths just as we saw during the last peak!

A peak in deaths usually comes with a lag of 2 wks. But this also follows the pattern of last peak (a bit early to say this though)

4/4

• • •

Missing some Tweet in this thread? You can try to force a refresh
 

Keep Current with Rijo M John, PhD

Rijo M John, PhD Profile picture

Stay in touch and get notified when new unrolls are available from this author!

Read all threads

This Thread may be Removed Anytime!

PDF

Twitter may remove this content at anytime! Save it as PDF for later use!

Try unrolling a thread yourself!

how to unroll video
  1. Follow @ThreadReaderApp to mention us!

  2. From a Twitter thread mention us with a keyword "unroll"
@threadreaderapp unroll

Practice here first or read more on our help page!

More from @RijoMJohn

23 Apr
Some epi models predict 8L-10L daily #COVID19 cases in India in the next 2-3 weeks. In all likelihood, India is already having that many daily infections. However, will India ever report that many daily new cases?

My guess: our reported cases will not go >5L to 6L!

why?

1/4
The daily growth of tests has been much lower than that of daily cases for the past 1 month.

The avg. TPR now is 18%. Our avg. daily testing now is 16L.

At the current TPR, it'd take 33L daily tests to report 6L cases, i.e., more than double the current daily testing.

2/4
TPR has also been on a steady growth path & even if we assume the TPR to reach 20%-25% in the coming weeks, it'd need 32L to 40L daily testing for us to report 8L cases. I believe, it is nearly impossible at the current level of testing & its rate of growth.

3/4
Read 4 tweets
20 Apr
It is to be noted that the policy shift in the government of India’s #COVID19 vaccination has come at a time when the daily inoculations of #COVID19 vaccines have been on a steady decline going down from a daily average of 3.7M to 2.7M in the past two weeks.
1/5
Domestic supply constraints & the Union government’s failure to ensure vaccine supply commensurate with demand from different states were evident on vaccine delivery so far.
2/5
This new liberalized policy could shift the onus of vaccine procurement to meet the demand onto the state governments, something the Union government itself has not been quite successful in the past as reflected in the slow pace of vaccination.
3/5
Read 5 tweets
23 Jan
#Kerala is seeing a steady increase of new #COVID19 cases & Test +ve rates.
👉It accounts for >40% of all new cases in India
👉Testing is pretty stagnated
👉Vaccination has been at a very low pace too. Only 47K Beneficiaries so far, while neighboring Karnataka did 1.83L
1/
The only solace has been a relatively low mortality rate compared to the rest of the country. This mortality rate has also seen a marginal increase in recent times. There are also discrepancies in reported deaths between some district administrations and the state.
2/
Districts like #Ernakulam, #Alappuzha, and #Pathanamthitta are seeing the maximum increase of new cases in recent days!
3/
Read 6 tweets
20 Nov 20
19 Nov: #India crossed 9M reported #COVID19 cases & 132202 deaths. 4.4L active cases
👉1M new cases & 12.1K deaths added in the past 23 days. The previous 1L cases were added in 18 days.

*⃣Follow this data thread to know important trends national, state & district level*⃣
1/ Image
👉Cases growing at 0.44% (it was 0.57% at 8M)
👉Steady fall in 7-day avg. daily new cases seem to have halted for now
👉Daily active cases still in -ve territory
👉Daily tests averaged 9.3L past 7 days (down from 10.5 at 8M)
👉Daily deaths ~500 (It was 511 at 8M)
2/ Image
👉Growth of tests slightly above that of cases now
👉Daily TPR at 4.2% and has been <5% level for 30 days now.
👉only 5.88 (45.4%) of the 12.96 crores tests so far are RT-PCR
👉Testing (whether RT-PCR or Rapid Antigen) need to increase significantly
3/ Image
Read 13 tweets
28 Sep 20
27 Sep: India crossed 6M reported #COVID19 cases & 95574 deaths. Only 9.6L active cases
👉Beyond the rosy recovery rates, follow this thread to know important trends upto dist. level that matters
👉1M new cases & 12K deaths were added in the past 11 days

(1/n)
👉Cases growth (1.5%) has decreased considerably over a week
👉7-day avg. daily cases showed some decline & is beginning to look up again
👉Daily active cases rebounding after being in -ve territory for few days
👉Daily tests average 10.8L last week
👉Daily deaths ~1095 (2/n)
👉Growth of tests barely above that of cases now
👉Daily TPR at 8.2% and has shown a marginal decline over the past 2 weeks
👉52% of all tests so far are Rapid antigen
👉Most states do not report test results by type of tests
(3/n)
Read 13 tweets
24 Sep 20
➡️The discrepancy between the daily testing numbers reported by ICMR & states have been growing steadily & has reached very high levels (2L+) of late!
➡️National TPR needn't be an avg of TPRs across states, as a result
➡️Lot of questions remain unanswered
@ICMRDELHI
(1/n) Image
Follow this thread here which gives plausible reasons but, none conclusive. A summary of important questions below:
1) Are states & ICMR including/excluding certain types of tests & not following a uniform standard in reporting?
(2/n)
2) Are states adding duplicates/retests to its total while ICMR doesn’t?
3) Is ICMR withholding certain tests/test types which states report?
4) Are states ‘deliberately’ inflating reported numbers in the interest of showing low TPR?
5) Only @ICMRDELHI can clarify these

(3/n)
Read 4 tweets

Did Thread Reader help you today?

Support us! We are indie developers!


This site is made by just two indie developers on a laptop doing marketing, support and development! Read more about the story.

Become a Premium Member ($3/month or $30/year) and get exclusive features!

Become Premium

Too expensive? Make a small donation by buying us coffee ($5) or help with server cost ($10)

Donate via Paypal Become our Patreon

Thank you for your support!

Follow Us on Twitter!