#BTC crashing?

TLDR: Short term pain, but bull phase intact.

1. $GBTC premium is -12.95%: Bearish
2. TA (daily): $22K-$39K
3. 6/25 Options: Price>$40K, bullish; Otherwise, bearish
4. Futures: Neutral-bullish
5. On-chain: Bullish
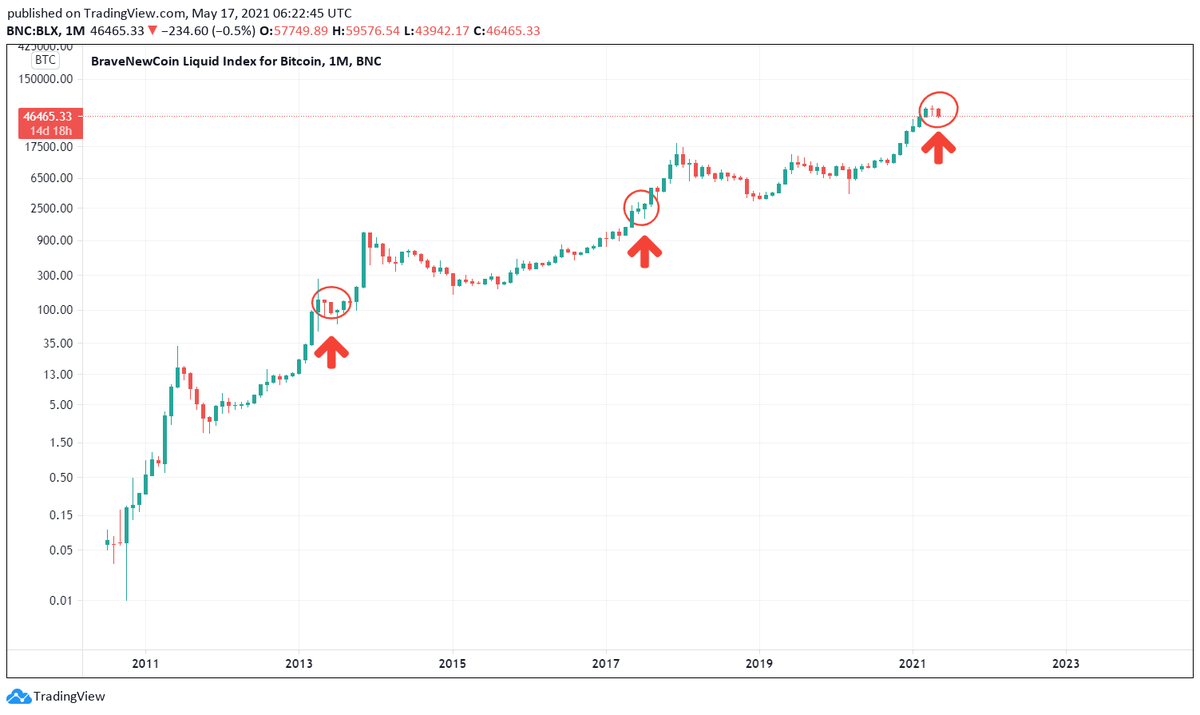
6. TA (monthly): Target: $184K-$346K in Oct '21
1/ $GBTC's premium is still double digit in the red amidst the unlock of 64M GBTC shares this month. This indicates the share unlock could contribute to downward pressure on #BTC's price.

2a/ As tweeted on 6/3/21, #BTC's price was forming a symmetrical🔺pattern. It broke out of the pattern to the downside yesterday & in the worst case, the target price is $22K.

It traded to $31K today & trend line #4 (cloned from #1) provided support & it bounced from that level. Image
2b/ If #BTC remains bearish and trades between trend lines:

#3 & #4: $28K on 6/19/21

#4 & #5: $24K on 6/19/21

#5 & #6: $22K on 6/19/21

#4 & #5: $22K on 6/29/21

* #3, #5 & #6 are cloned from #1
2c/ If it is a bear trap and #BTC begins to trade between trend lines:

#2 & #3: $39K on 6/19/21
$37K on 6/29/21

#1 & #2: $48K on 6/19/21
$46K on 6/29/21

* #2 is cloned from #1
3/ Deribit's #BTC options expiring on 6/25/21 indicate that if BTC's price is <$40K, bears are in control and the support levels are:

$36K/$32K/$28K/$24K/$20K

If BTC's price is >$40K, the resistance levels are:

$44K/$48K/$50K/$52K Image
4/ #BTC futures market isn't over-extended. It's net short as funding rates at major exchanges are negative. The futures OI has declined to levels seen in January 2021.

There's a slight uptick in OI indicating a neutral to bullish BTC price action. A short squeeze is possible. Image
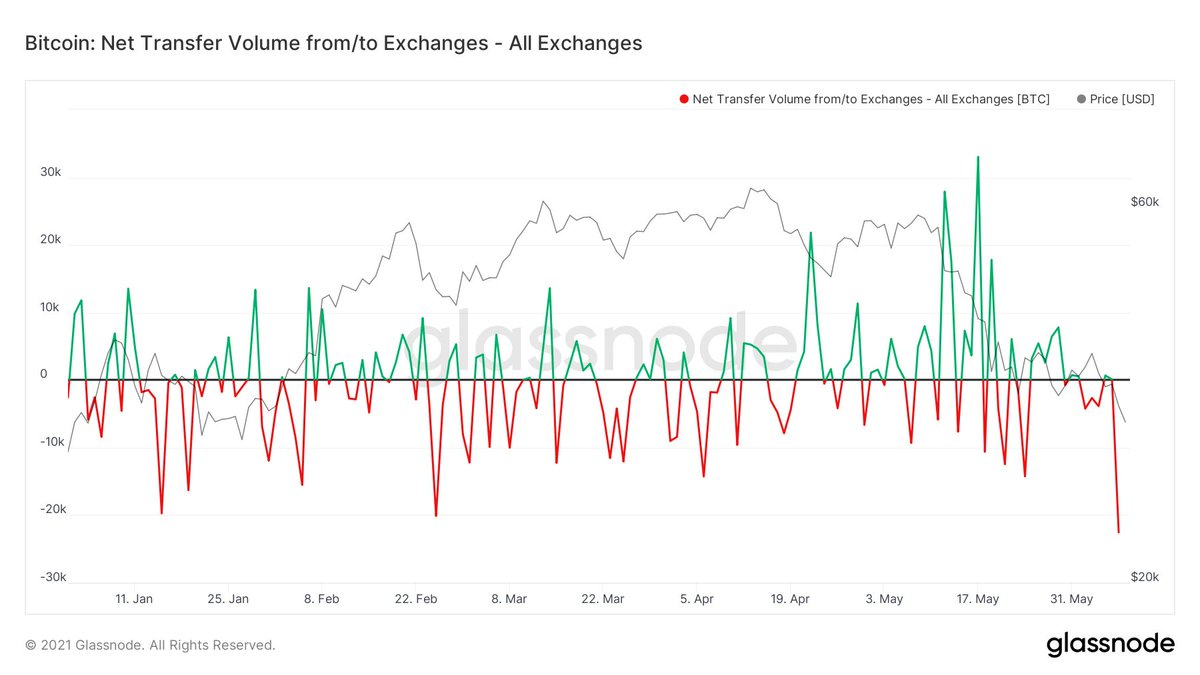
5/ Recent #BTC on-chain metrics are not bearish.

i. Exchange net flow volume had the highest YTD outflow on 6/7/21 (22.5K BTC). Institutions bought up BTC and sent them to cold storage. Majority came from Kraken ($600M). ImageImage
5 ii. LT HODLers net #BTC position change has turned positive, indicating they are accumulating BTC has BTC's price corrects from its ATH.

aSPOR shows BTC's price is favorable for buying the dip and this explains why LT HODLers are buying BTC. ImageImage
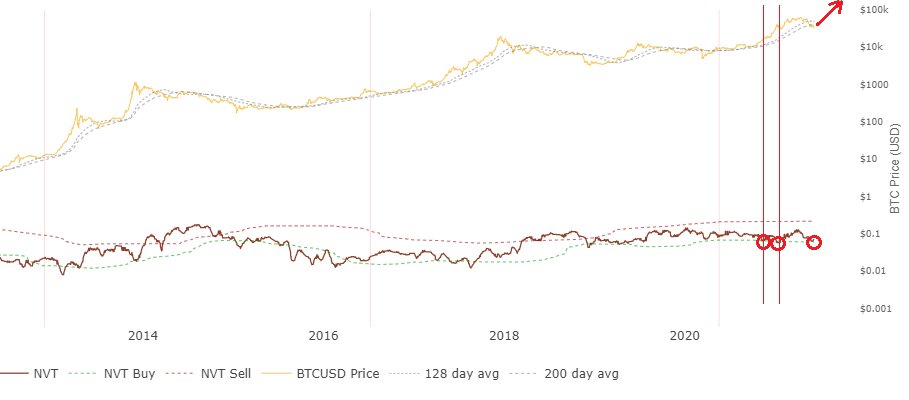
5 iii. Willy Woo's NVT indicator shows that #BTC has reached the NVT buy zone. Every time, BTC hits the NVT buy line (green), it rallies. This may happen soon if this plays out. Image
5 iv. Miners are selling because of the China crackdown on #BTC mining, but the 2013 fractal could be at play -- Miners selling around mid-cycle dip and then reaccumulate before selling as BTC peaks. ImageImage
6/ Seems #BTC is trading like its 2013 bull phase. 2 mo. red candles & a lower low followed by a rally to the peak. If so, BTC will correct 30% from the May low to $21K & then rally to the top.

If the peak is between that of 2013 & 2017, the price is $184K-$346K in Oct. Image

• • •

Missing some Tweet in this thread? You can try to force a refresh
 

Keep Current with Allen Au 🧢

Allen Au 🧢 Profile picture

Stay in touch and get notified when new unrolls are available from this author!

Read all threads

This Thread may be Removed Anytime!

PDF

Twitter may remove this content at anytime! Save it as PDF for later use!

Try unrolling a thread yourself!

how to unroll video
  1. Follow @ThreadReaderApp to mention us!

  2. From a Twitter thread mention us with a keyword "unroll"
@threadreaderapp unroll

Practice here first or read more on our help page!

More from @AllenAu11

10 Jun
𝗖𝗧𝗠 #𝗕𝗧𝗖 𝗢𝗻-𝗖𝗵𝗮𝗶𝗻 𝗠𝗲𝘁𝗿𝗶𝗰 𝗗𝗮𝘀𝗵𝗯𝗼𝗮𝗿𝗱: 𝗪𝗲𝗲𝗸 𝟮𝟮 𝟮𝟬𝟮𝟭

𝗕𝗧𝗖 𝗣𝗲𝗮𝗸 𝗜𝗻𝗱𝗶𝗰𝗮𝘁𝗼𝗿𝘀

TLDR: All 7 indicators show that BTC has neither peaked nor is in its bear phase

Note #3, #4 & #7 indicate that BTC could be in its mid-cycle correction*
* #4 & #7 show that BTC is behaving like its price action 6 days before the final dip in the mid-cycle correction in 2013.

If this plays out, we could see the low of the mid-cycle correction in 2021 around 6/12/21.👀

HODL #BTC!
𝟭. 𝗠𝗩𝗥𝗩-𝗭 𝗦𝗰𝗼𝗿𝗲 (>𝟳.𝟱): 𝗡𝗼

6/6/21 Value: 1.63

For #BTC to enter its bear phase, MVRV-Z Score will go to the pink zone first and then trend downward. This hasn't happened yet. Image
Read 9 tweets
2 Jun
Since mid-April, #BTC has corrected by 53% & this coincided w/ the unlock of 90M $GBTC shares while its premium <-10% for most of the time.

Did the unlock of these shares contribute to BTC's major correction? More coming? Price floor?

TLDR: Probable. Depends. $25K-$30K in June
1/ Let's first review some background information.

Accredited investors could subscribe for $GBTC shares from the Grayscale Bitcoin Trust (Trust) at (Net Asset Value) NAV in 3 ways though there is a 6-month lock up before they could sell their shares in the secondary market.
2a/ Use cash to buy $GBTC shares at NAV

i. If the premium persists upon the 6-mo unlock, investors are able to realize the spread
ii. They can gain #BTC exposure if there's a sustained premium
iii. This's what most institutional investors did until GBTC's premium became -ve
Read 17 tweets
17 May
Amid all the gloom & doom about #BTC, let's do some in depth TA!

4-year cycle broken? V-shaped rebound? When? Seen correction low?

TLDR:

1 BTC price is tracking past cycles'
2 Price dump expected today
3 There could be a lengthening of this cycle
4 Peak price: $260K-$360K
1/ #BTC's recent price action is puzzling as it doesn't seem to follow the previous cycles'.

I was perplexed until I zoomed out & looked closely at the monthly BLX log chart to find my bearings.

BTC's price action is tracking its previous cycles'! BTC's 4-year cycle is intact. Image
2a/ I'm tracking the @HalvingTracker charts, but I've been looking at the wrong portions of the charts of previous cycles (🔵).

Using the monthly BLX log chart, I found out where #BTC is at (🔴) and where it is supposed to be in previous cycles and it all makes sense! Image
Read 10 tweets
14 May
𝗖𝗧𝗠 #𝗕𝗧𝗖 𝗢𝗻-𝗖𝗵𝗮𝗶𝗻 𝗠𝗲𝘁𝗿𝗶𝗰 𝗗𝗮𝘀𝗵𝗯𝗼𝗮𝗿𝗱: 𝗪𝗲𝗲𝗸 𝟭𝟵 𝟮𝟬𝟮𝟭

#𝗕𝗧𝗖 𝗣𝗲𝗮𝗸 𝗜𝗻𝗱𝗶𝗰𝗮𝘁𝗼𝗿𝘀

TLDR: All indicators show that #BTC is nowhere near its peak in the current cycle.

HODL #BTC!
𝟭. 𝗠𝗩𝗥𝗩-𝗭 𝗦𝗰𝗼𝗿𝗲 (>𝟳.𝟱): 𝗡𝗼

5/13/21 Value: 3.08 Image
𝟮. 𝟭-𝗬𝗿+ 𝗛𝗢𝗟𝗗 𝗪𝗮𝘃𝗲 (~𝟰𝟳%): 𝗡𝗼

5/13/21 Value: 55% Image
Read 8 tweets
1 May
#Bitcoin returned -1.98% in 4/21. Would #BTC have a negative return month in 5/21?

TLDR: No. Traditionally, May is a decent month for #BTC with monthly returns averaging 18%.

Target prices: $67K-$80K

Time to reach targets: 5/5-5/31

Low: $50K-$55K
1a/ Let's recap. #BTC didn't had a good month in 4/21 as expected, but it hit the lowest price target of $64K. After that, it corrected 27% to $47K before rebounding to $58K on 4/30.

I thought the 2nd dip (blue) corresponded to those of the last 2 cycles, but that wasn't it.
1b/ CTM now has its own ATH Tracker. Big shout out to @irandall13! We could track the projected price action of #BTC with more precision!

Per the ATH Tracker, #BTC could have a major run up in 5/21.
Read 16 tweets
13 Dec 20
Confused by the myriad of price predictions for #Bitcoin in 2021. There are a few pricing models for $BTC and they could be grouped as follows:

1. Halving cycle
2. On-chain metrics
3. Market cap
4. Use case
5. Stock-to-flow
6. Magic wand

Which one to lean into? Read on.
1a/ These use technical analysis of the price action of #Bitcoin in previous halving cycles to forecast the price of $BTC, such as Citibank’s. However, the most accurate one to date is Jordan Lindsey’s @jclcapital as detailed in his $BTC video playlist.

1b/ Jordan’s model gives a 2021 price target of $140K-$160K for #Bitcoin. He predicts a shortening of the current $BTC bull phase and a cycle top in 9/2021. He uses a dynamic tracker to seek out the $BTC peak. Follow the daily livestreams on his Youtube channel to get updates.
Read 10 tweets

Did Thread Reader help you today?

Support us! We are indie developers!


This site is made by just two indie developers on a laptop doing marketing, support and development! Read more about the story.

Become a Premium Member ($3/month or $30/year) and get exclusive features!

Become Premium

Too expensive? Make a small donation by buying us coffee ($5) or help with server cost ($10)

Donate via Paypal Become our Patreon

Thank you for your support!

Follow Us on Twitter!

:(