In Paytm Spaces, following points came up for discussion. Here are my two cents on questions for budding traders.
Basic questions asked were about the trading journey. Most of my followers know how I started. Blew up, did a job, resigned, started and now surviving 1/n
Basic questions asked were about the trading journey. Most of my followers know how I started. Blew up, did a job, resigned, started and now surviving 1/n
Do's for Beginners
1. Start with small capital and try to constantly increase it organically. Like start with 10% of what you can afford to lose. If you are consistently profitable then increase slowly.
2. Start thinking in % gain / loss terms from start.
2/n
1. Start with small capital and try to constantly increase it organically. Like start with 10% of what you can afford to lose. If you are consistently profitable then increase slowly.
2. Start thinking in % gain / loss terms from start.
2/n
3. Think about Risk first then Reward.
4. Define your circle of competence.
Don't
1. If you have less money & want to trade options, it's better to trade in monthly nifty or liquid stock options. As a beginner do not go for Bank Nifty.
2. Never trade naked. Always put a SL. 3/n
4. Define your circle of competence.
Don't
1. If you have less money & want to trade options, it's better to trade in monthly nifty or liquid stock options. As a beginner do not go for Bank Nifty.
2. Never trade naked. Always put a SL. 3/n
How do you tackle trading during such highs?
1. Trading at highs is good. All you must do is find the right stock which is moving with good Risk: Reward and let the probabilities play out.
2. Problem people are facing is due to low Vix and low premiums. 4/n
1. Trading at highs is good. All you must do is find the right stock which is moving with good Risk: Reward and let the probabilities play out.
2. Problem people are facing is due to low Vix and low premiums. 4/n
3. Unless we get a direction, do risk defined strategies where RR is incredibly good.
4. Iron Butterfly
5. Short Call/Put Butterflies
6. Ratio Calendars
7. Avoid naked shorts unless we get a clear direction.
5/n
4. Iron Butterfly
5. Short Call/Put Butterflies
6. Ratio Calendars
7. Avoid naked shorts unless we get a clear direction.
5/n
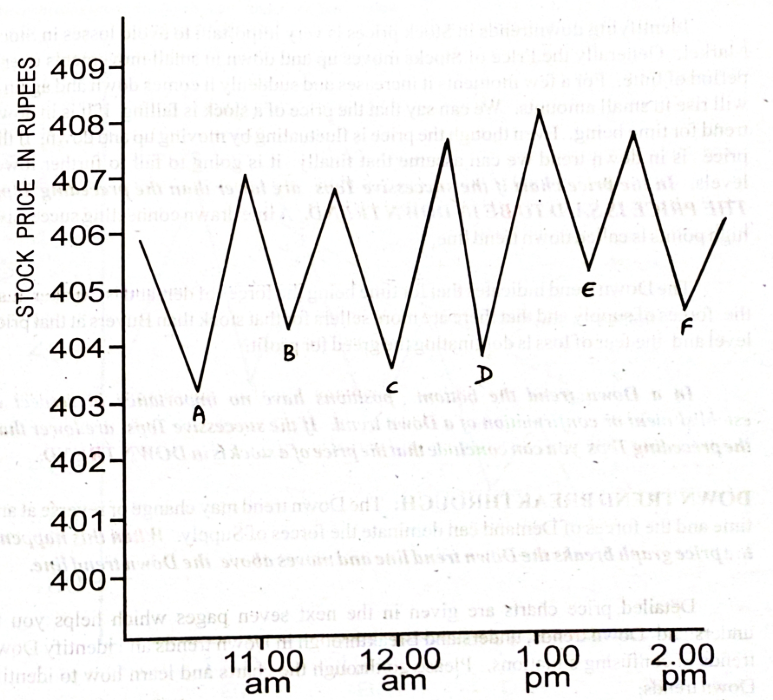
8. Clearly define what is trending, what is consolidation and then act accordingly.
What should beginners focus on during an all-time high market?
1. All time high or not good stocks are always moving up. Just don’t do a forced trade.
6/n
What should beginners focus on during an all-time high market?
1. All time high or not good stocks are always moving up. Just don’t do a forced trade.
6/n
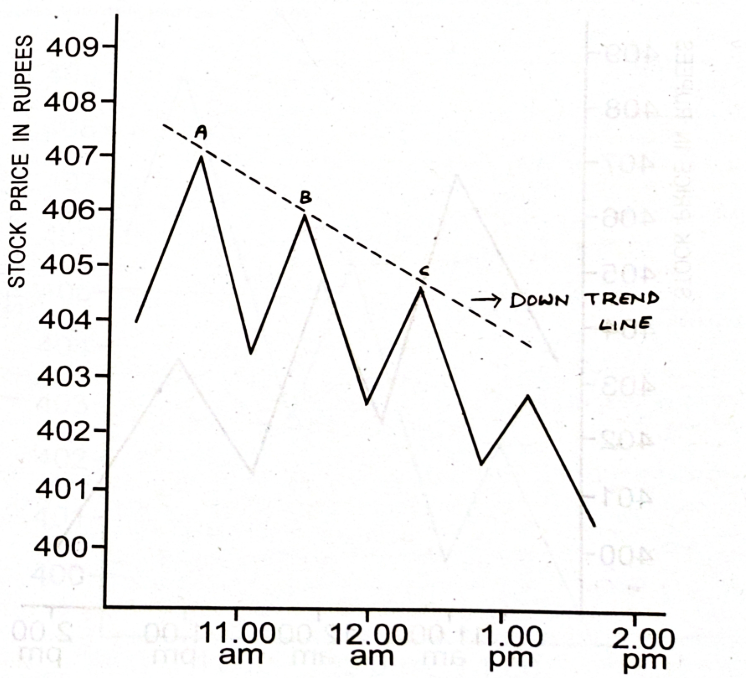
2. As a thumb rule buy stocks price of which on daily charts are on the top right side of the chart. Avoid stocks which are on lower right side of the chart. @InvesysCapital
7/n
7/n
How do you handle the drawdown phase or the psychological part during losses?
1. You must be your own psychologist at such times.
2. Bad temperament in market can attract disaster.
3. You must define a point where you pull in the plug
4. I get aggressive when I am in profit.
8/n
1. You must be your own psychologist at such times.
2. Bad temperament in market can attract disaster.
3. You must define a point where you pull in the plug
4. I get aggressive when I am in profit.
8/n
When losses, I remain conservative till the time things are not back to normal.
5. Never do revenge trading.
Advise to traders
1. Your Technical System is just 20% of your Trading System. Rest of it is Risk Management & Position Sizing.
9/n
5. Never do revenge trading.
Advise to traders
1. Your Technical System is just 20% of your Trading System. Rest of it is Risk Management & Position Sizing.
9/n
2. Risk : Reward – how much you lose or how much you win
3. Winning Probability – 50%+
4. Diversification – Having eggs in different baskets. Like different strategies. If one does not perform, other will.
End of Thread
3. Winning Probability – 50%+
4. Diversification – Having eggs in different baskets. Like different strategies. If one does not perform, other will.
End of Thread
• • •
Missing some Tweet in this thread? You can try to
force a refresh