A longitudinal study of #Bitcoin's supply distribution since the genesis block.
Summary: Bitcoin continues a 12 year trend of distributing evenly. Small holders are a rising force.
(Includes new data unseen before.)
Summary: Bitcoin continues a 12 year trend of distributing evenly. Small holders are a rising force.
(Includes new data unseen before.)

Before I continue, all the data used in this study are actual entities, not addresses.
Addresses are clustered forensically to resolve to individual participants.
In some cases they monitored on-chain entities (e.g. exchanges) in other cases from financial reporting (e.g. ETFs)
Addresses are clustered forensically to resolve to individual participants.
In some cases they monitored on-chain entities (e.g. exchanges) in other cases from financial reporting (e.g. ETFs)
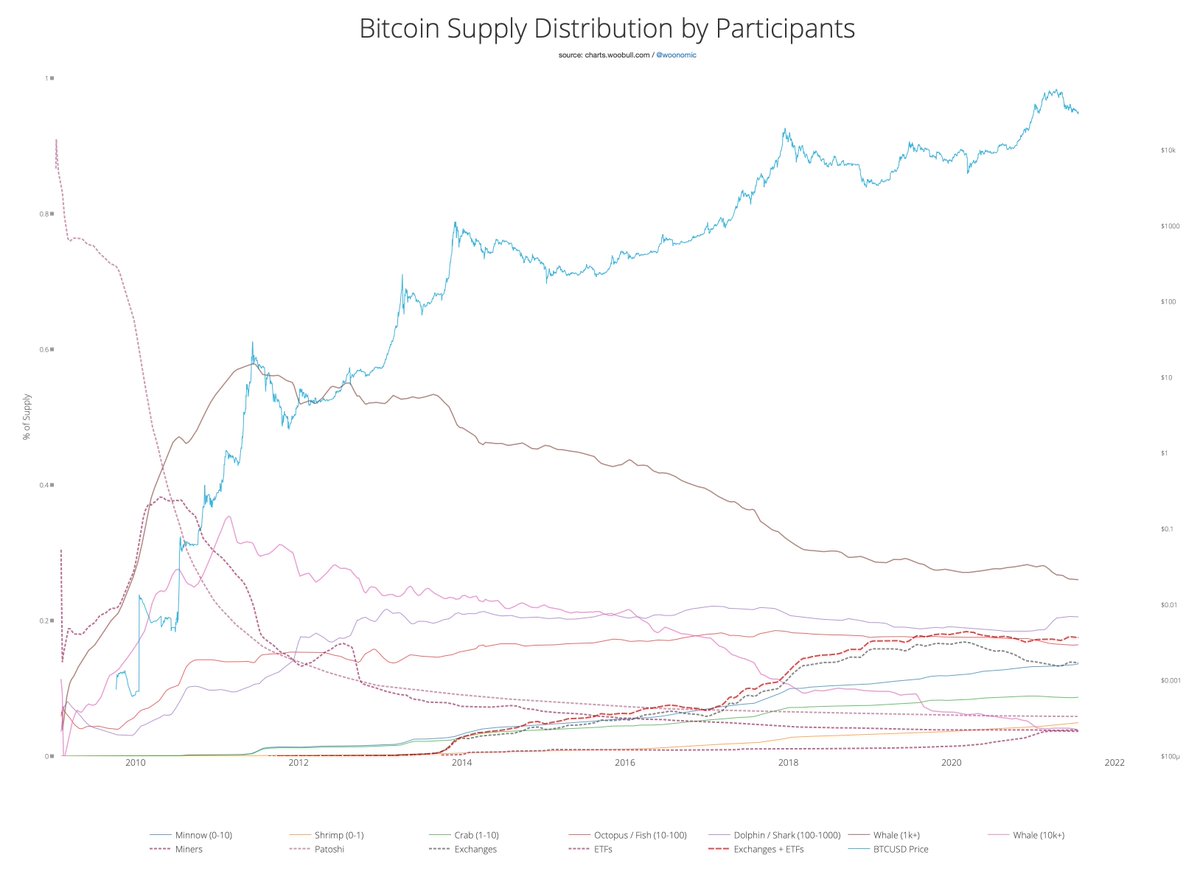
Whales (1000+ BTC in wealth) continue to distribute their coins while minnows are increasingly gaining more of the supply (0-10 BTC).

The Bitcoin "middle class" are the holders between 10 - 1000 BTC. They have more or less remained steady.
Since 2018 the subtle trend is similar to whales, towards more even distribution, as the give up their coins to smaller holders.
Since 2018 the subtle trend is similar to whales, towards more even distribution, as the give up their coins to smaller holders.
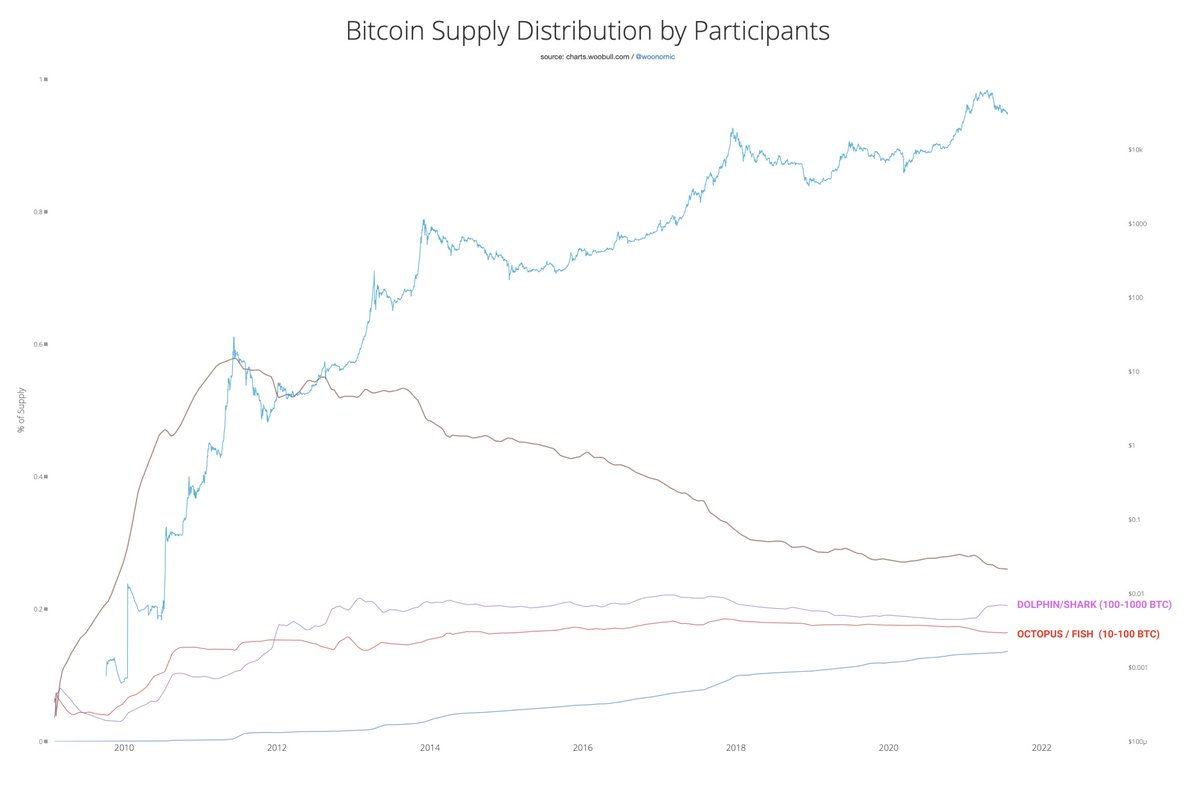
The story for 2021 is the rise of the dolphins and sharks (very roughly $3m - $60m in BTC at 2021 prices).
This rise is likely from high net worth individuals, family offices, hedge funds and smaller corporate treasuries. They absorbed much of whale distribution.
This rise is likely from high net worth individuals, family offices, hedge funds and smaller corporate treasuries. They absorbed much of whale distribution.

The mega wealthy 10k+ whale club ($300m+) has almost vanished, they hold 3.75% of the supply today.
This compares to 26.0% held by the 1k+ whale club.
(10k+ whales are counted in the 1k+ whale figures).
This compares to 26.0% held by the 1k+ whale club.
(10k+ whales are counted in the 1k+ whale figures).

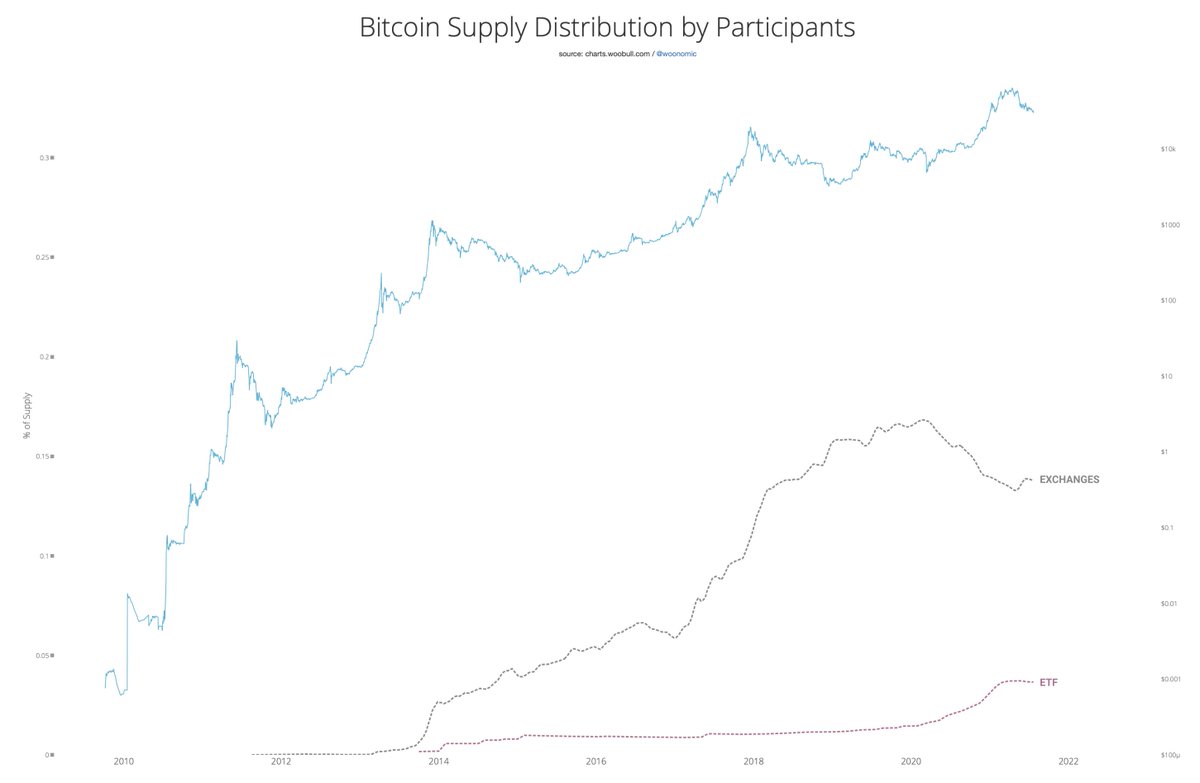
Of growing importance are entities who have custody of coins owned by many.
Exchanges have 13.8% of the supply with in excess of 150m unique verified accounts in 2021.
ETFs have 3.7% of the supply.
Exchanges have 13.8% of the supply with in excess of 150m unique verified accounts in 2021.
ETFs have 3.7% of the supply.
TREND: Coins are moving to the masses.
Whales (1000+ BTC) hold 26.0%.
Exchanges and ETFs collectively hold 17.5% on behalf of 150m+ customers
Minnows (0-10BTC) hold 13.6%.
Minnows are close to holding most of the supply. (Minnows + exchanges/ETFs hold 31% vs whales at 26%).
Whales (1000+ BTC) hold 26.0%.
Exchanges and ETFs collectively hold 17.5% on behalf of 150m+ customers
Minnows (0-10BTC) hold 13.6%.
Minnows are close to holding most of the supply. (Minnows + exchanges/ETFs hold 31% vs whales at 26%).

For completeness, this trace is Satoshi's coins (5.8% of the supply).
I've removed them from the supply owned by whales as the Satoshi coins are assumed 'lost'.
I've removed them from the supply owned by whales as the Satoshi coins are assumed 'lost'.

These are the coins held by miners at 3.9% of the supply.
Their coins have not been removed from the cohorts. (If you're a whale miner, your coins count as a whale, ditto for minnow miners etc).
Miners have been distributing their coins for a decade.
Their coins have not been removed from the cohorts. (If you're a whale miner, your coins count as a whale, ditto for minnow miners etc).
Miners have been distributing their coins for a decade.

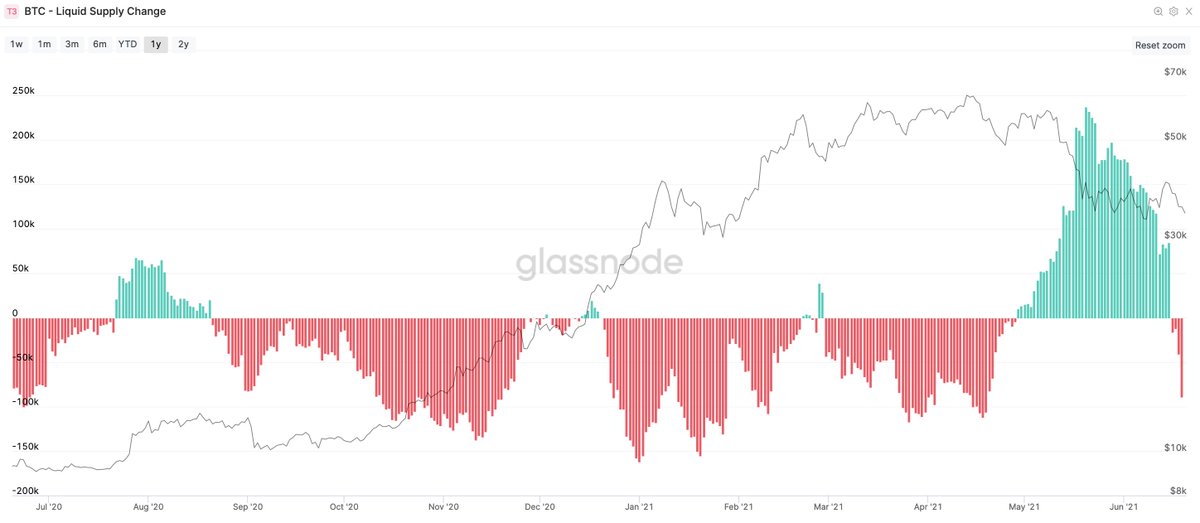
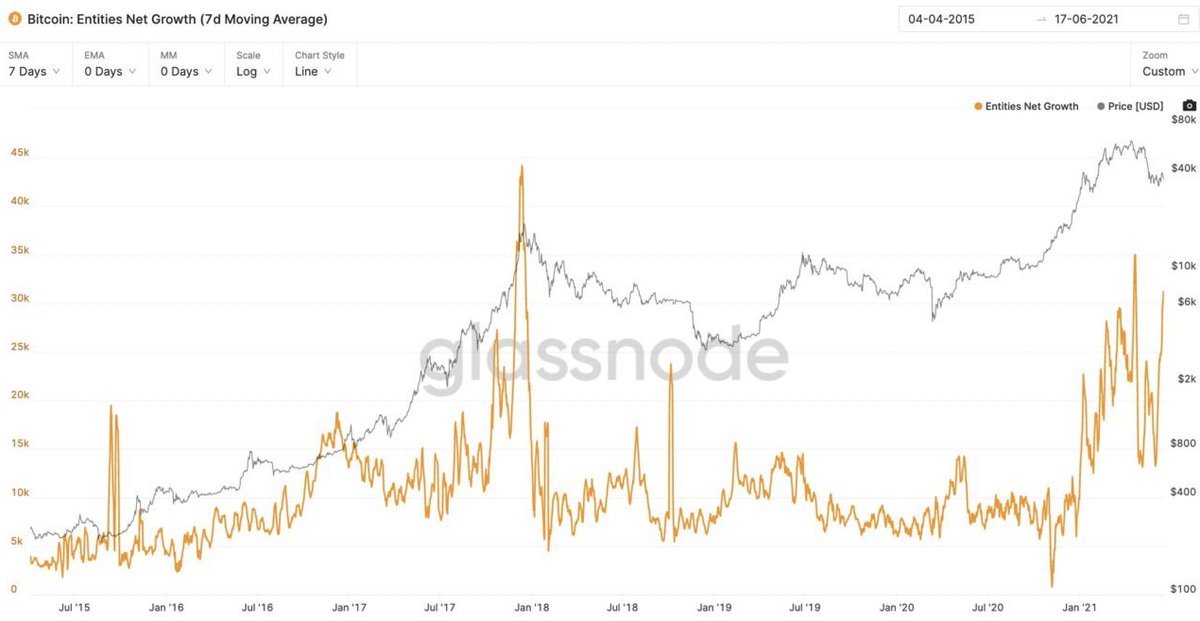
Sidenote: whales distribute their coins on every bull rally.
I've included 2 charts:
1) What whales are really doing (orderly distribution each bull market)
2) misleading results from address analysis w/o clustering and eco system adjustments (whales pump and dump the market)
I've included 2 charts:
1) What whales are really doing (orderly distribution each bull market)
2) misleading results from address analysis w/o clustering and eco system adjustments (whales pump and dump the market)


Address analysis done badly is the culprit for much FUD thrown at this industry.

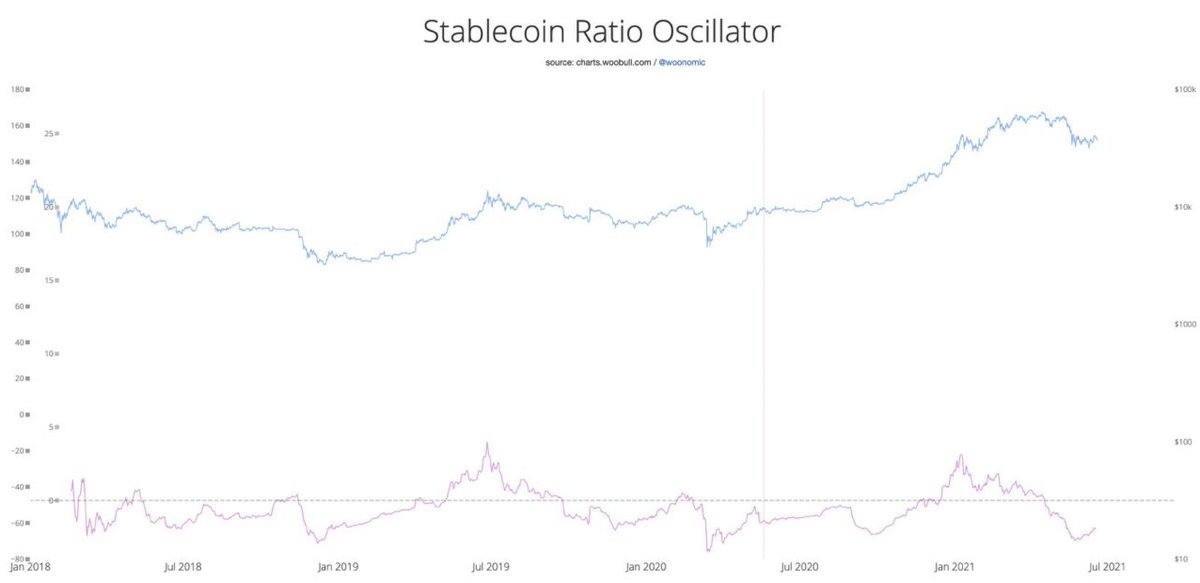
Finally here's the full ecosystem in one chart.
On-chain data: @glassnode
ETF data: @woonomic (via the art of data archeology, scraping the web for historical data)
On-chain data: @glassnode
ETF data: @woonomic (via the art of data archeology, scraping the web for historical data)
• • •
Missing some Tweet in this thread? You can try to
force a refresh