We now enter the week that most of us on the chart below put down as the US #Covid19 peak. The average had us peaking by 8/12 (23 days). The mode/median was by 8/10 (3 weeks). So how are we doing?
Well, 8/4 has come and gone, and US reported cases per the CDC have decidedly not peaked. But was 8/4 close? Are we close now? I think so, but that depends on two factors: (1) test levels, and (2) reporting lags. If we tested/reported like the UK, we may already be post-peak.
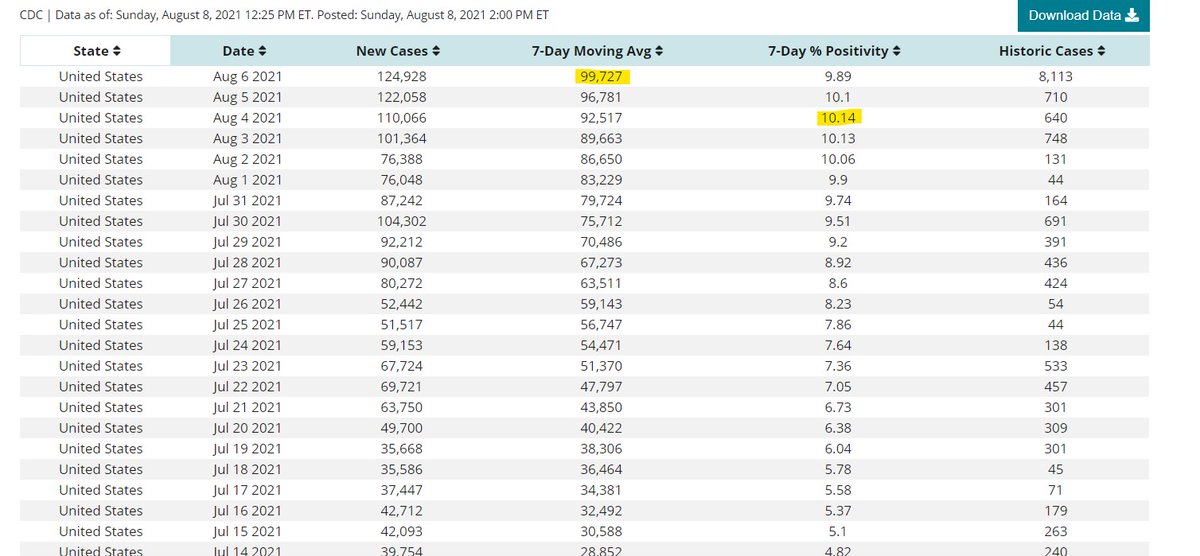
Take a look at the screenshot from the CDC. I've highlighted the 7DA cases and the 7DA positivity %. Now these numbers can "breathe" a bit as the CDC backfills data over time, but you see we're still on the way up in terms of cases. Not necessarily so in terms of % positive.
The UK hit its 7DA peak of 47,696 reported cases on the *same day* that it hit its % positive peak of 4.78%. Why? They maintained a high testing level per capita—5x to 6x that of the US—and have a more standardized reporting system.
The US hasn't captured nearly the percentage of infections (via testing, which equals cases) as the UK. Had we tested like them, I don't know if we/the media could have handled seeing those case numbers. It's one thing to know infections could = 5-7x cases, but another to see it.
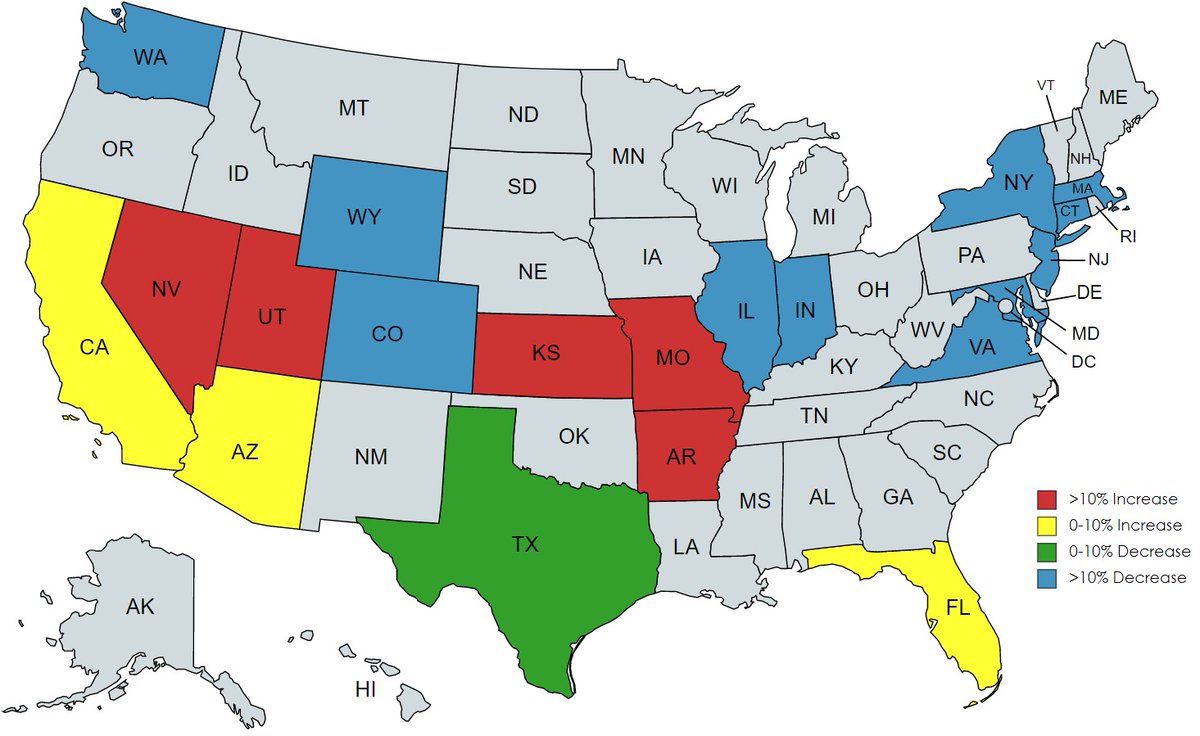
It's tough trying to hit a moving target with US reported cases. Our rise in tests *appear* to be outpacing our rise in cases at this point. That is borne out in several early mover states, in which the % positive peak precedes the reported case peak, sometimes by several days.
But % positive doesn't even account for the case reporting lag that tends to be longer in the US as a whole than smaller/more routinized reporting countries, though it varies by state. In the past, it has also tended to be worse (more "laggy") during surges like now.
What's all this mean? We're probably around, or near, or even just past, our actual infection peak by now. It means in making my optimistic 8/4 *reported* prediction, I "fell victim to one of the classic blunders:" I unwittingly scoffed long-tailed reporting and test increases.
(Come to think of it, in my 10+ years active duty, I also got involved in a land war in Asia, so I suspect Vizzini's doubly disappointed in me)
Bottom line: I think we're still about right in the wheelhouse with the 3-week prediction. If we continue to ratchet up tests materially, then it's tougher to find *the* peak. I do think our % positive peak will remain in the first week of August when the data's sorted, though.
• • •
Missing some Tweet in this thread? You can try to
force a refresh
Folks, I urge a little caution with the Florida #Covid19 numbers showing on the CDC right now. FL reports its Sat+Sun+Mon numbers on Mondays, which the CDC *usually* updates on Tuesday for the 3-day span (and divides the total by 3).
Please read this brief thread...
For whatever reason (maybe an earlier report time?), it appears that the CDC used FL's 3-day total of 56,633, which they would normally report as 18,878/day for the 3-day span. The CDC hasn't updated FL's #'s on Monday for a while. Here's how the days usually end up:
So, reporting/backdating just Sat/Sun is nonstandard hasn't been done lately. Usually there are just 0-0 as placeholders until the CDC updates the case numbers on Tuesday for all three previous days.
I wanted to take a look at the trend in hospitalization census in states that are now predominantly #DeltaVariant according to the graphic below (including FL & IL, which are close). I'll do some comparisons to Alpha back in April as well.
🧵Thread🧵
First, here is a map of the 2-week change in 7-day-average hospitalization census for each of the states above (according to state dashboards as of yesterday's data, compared to the average on Friday 2 weeks prior):
At a glance, low vax states tend to be doing the worst, which makes intuitive sense (though we're discounting prior infection by looking only at vax status, of course). But there are outliers. For example, why should IN be on a better trajectory than CA?
(Data retrieved directly from state dashboards. Not every state updates its numbers daily.)
SUN BELT
(AL, AR, AZ, CA, GA, LA, MS, NM, NV, SC, TN, TX)
Today’s Sun Belt raw reported metrics:
- Tests: 202,436 (-19,171)
- Cases: 6,956 (+1,917)
- Deaths: 141 (-32)
- Hospitalized: 5,934 (-49)
- ICU: 1,303 (-29)
(Tests/Cases/Deaths: +/- = chg from raw count same day last week)
(Hosp/ICU: +/- = chg from yesterday’s census)
Last Sun Belt-only update this week. Tomorrow we’ll have the US numbers and standard regions. Hospitalizations and ICUs down from yesterday, and deaths down from last week. Cases are up, though CA is still reporting backlogged cases this entire week (& is ~40% of the increase).
First, we're not "2 weeks past the Memorial holiday weekend data issues." Memorial Day deflates reported cases & deaths for *days after* Memorial Day. The Tuesday is extremely deflated, and usually it takes days to return to normal pipeline reporting. This time was no different.
Also, what do you think happens to the 7-day average when metrics are deflated into the middle or late portion of the holiday week? It captures that deflation and carries it further, of course. So the 7-day average is artificially low typically through the *following* ~Wed.
Got a bit curious about the US v. UK as it relates to the #DeltaVariant. Some good news on that front for the US: at least in the early stages, the US rate of increase is nowhere near the UK.
🧵thread🧵
First: I used covariants.org/per-country, which shows percentage of sequenced variants based on 2-week blocks. One potential point of confusion to note when you use the site: the dates along the x-axis indicate the *start* of the 2-week period.
Here are the percentages of sequences that made up the #DeltaVariant in the UK (by 2-week period):