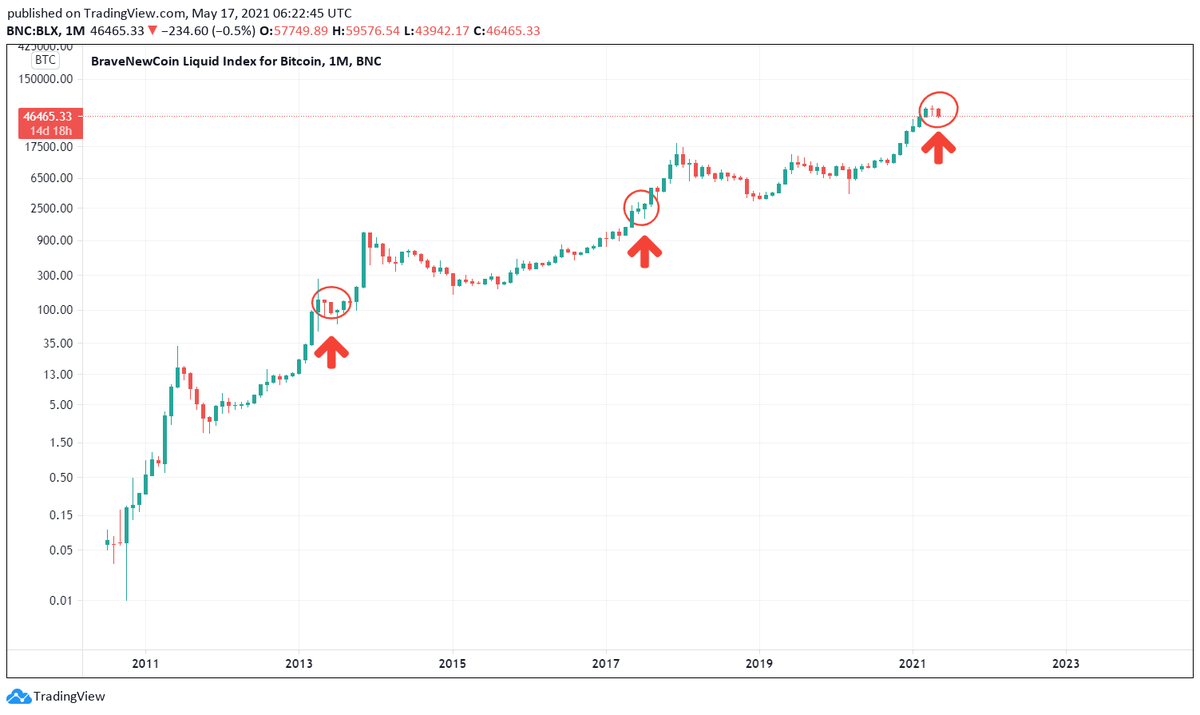
Deducing #BTC's Peak Price from its Golden Crosses*

TLDR: There'd be a relationship between when the first golden cross occurs after a BTC bear phase & its peak price. The secret lies in "4".

If so, BTC's peak price may be $143K in this cycle (see Notes).

*50d EMA 🔀 200d EMA
1/ Right before the 1st halving, a golden cross occurred & #BTC rallied 235x from the golden cross daily closing price to the 2nd cycle top.

Similarly, after the bear phase of the 2nd cycle, a golden cross occurred & BTC's price rallied 60x to the 3rd cycle top.

NB: 235/60= ~4 Image
2a/ Right after the bear phase of the 3rd cycle, a golden cross also occurred & #BTC's price rallied 12.5X from the golden cross daily closing price to its ATH of $64.9K.

A mid-cycle correction ensued where BTC corrected by 55% & BTC's price dipped below its 200 day EMA.
2b/ #BTC's price dipped below its 200 day EMA during the mid-cycle low in the 2nd cycle.

There were 2 tops in that cycle. The price increased 52x from the golden cross daily closing price to the 1st top & 17.5x from the mid-cycle low daily closing price to the final top. Image
3/ If $64.9K is #BTC's interim top in this 4th cycle like the 2nd cycle, there's another top to be had in this cycle.

It so happens that the price increase from the first & only golden cross in the 2nd cycle is 4 times that of the current one.

NB: 52/12.5= ~4 Image
4/ If 4 is the magic number, it's possible that #BTC's price increase from the current mid-cycle low daily closing price to the cycle top is 1/4 of that in the 2nd cycle.

Mid-Cycle Low DC Price: $32545
Projected Price Increase: 17.5x/4= 4.4x
Cycle Peak Price: $32545 x 4.4= $143K Image
5/ Notes:

$143K is similar to #CTM's "Mission Accomplished Price", but not the projected peak target of $260K-$410K. My base case is a lot higher also.

1st Cycle- Genesis block-1st halving
2nd Cycle- 1st to 2nd halving
3rd Cycle- 2nd to 3rd halving
4th Cycle- 3rd to 4th halving

• • •

Missing some Tweet in this thread? You can try to force a refresh
 

Keep Current with Allen Au 🧢

Allen Au 🧢 Profile picture

Stay in touch and get notified when new unrolls are available from this author!

Read all threads

This Thread may be Removed Anytime!

PDF

Twitter may remove this content at anytime! Save it as PDF for later use!

Try unrolling a thread yourself!

how to unroll video
  1. Follow @ThreadReaderApp to mention us!

  2. From a Twitter thread mention us with a keyword "unroll"
@threadreaderapp unroll

Practice here first or read more on our help page!

More from @AllenAu11

15 Aug
I've developed 4 #BTC indicators using @glassnode's workbench for detecting:

1. Buy & sell signals
2. Bear phase bottom
3. Top before final lift off + Timing of blow-off top
4. Best BTC accumulation periods

Also, I've rebuilt Willy Woo's Top Cap model for finding BTC's peak. Image
1a. Buy & Sell Signals

This indicator is developed from #BTC's moving average price. It gives accurate buy & sell signals of BTC.

It's simple to use: Whenever BTC's price is above the orange trend line, buy. Otherwise, sell.

It's now a good time to buy #Bitcoin! Image
1b. To simplify things further, I have made an oscillator for this Buy & Sell Signals indicator.

Note that when this oscillator > 2, #BTC is near an interim top or cycle top.

Oscillator >= 1 ➡️ Buy
Oscillator < 1➡️ Sell
Oscillator >2 ➡️ Near interim or cycle top Image
Read 12 tweets
26 Jul
𝗖𝗧𝗠 #𝗕𝗧𝗖 𝗢𝗻-𝗖𝗵𝗮𝗶𝗻 𝗠𝗲𝘁𝗿𝗶𝗰 𝗗𝗮𝘀𝗵𝗯𝗼𝗮𝗿𝗱: 𝗪𝗲𝗲𝗸 𝟮𝟴 & 𝟮𝟵 𝟮𝟬𝟮𝟭

𝗕𝗧𝗖 𝗣𝗲𝗮𝗸 𝗜𝗻𝗱𝗶𝗰𝗮𝘁𝗼𝗿𝘀

TLDR: BTC hasn't peaked yet.

Did a deep dive into some metrics to show BTC isn't in its bear phase. If it was, it's bottomed & would move higher!
There's been endless debates if #BTC is in its bear phase. As I’ve tweeted many times, BTC has been in a mid-cycle correction. To put this issue to bed, I’ll do a deep dive into a few BTC’s Peak Indicators that seem to be flashing bearishness when they aren't.
𝗮. 𝗠𝗩𝗥𝗩-𝗭 𝗦𝗰𝗼𝗿𝗲
As this metric has recently peaked near the pink zone, #BTC is in its bear phase.

It's been 156 days since this metric peaked on 2/21/21. In past bear phases, this metric would've values <1. The lowest so far is 1.09 in the current cycle.
Read 12 tweets
10 Jun
𝗖𝗧𝗠 #𝗕𝗧𝗖 𝗢𝗻-𝗖𝗵𝗮𝗶𝗻 𝗠𝗲𝘁𝗿𝗶𝗰 𝗗𝗮𝘀𝗵𝗯𝗼𝗮𝗿𝗱: 𝗪𝗲𝗲𝗸 𝟮𝟮 𝟮𝟬𝟮𝟭

𝗕𝗧𝗖 𝗣𝗲𝗮𝗸 𝗜𝗻𝗱𝗶𝗰𝗮𝘁𝗼𝗿𝘀

TLDR: All 7 indicators show that BTC has neither peaked nor is in its bear phase

Note #3, #4 & #7 indicate that BTC could be in its mid-cycle correction*
* #4 & #7 show that BTC is behaving like its price action 6 days before the final dip in the mid-cycle correction in 2013.

If this plays out, we could see the low of the mid-cycle correction in 2021 around 6/12/21.👀

HODL #BTC!
𝟭. 𝗠𝗩𝗥𝗩-𝗭 𝗦𝗰𝗼𝗿𝗲 (>𝟳.𝟱): 𝗡𝗼

6/6/21 Value: 1.63

For #BTC to enter its bear phase, MVRV-Z Score will go to the pink zone first and then trend downward. This hasn't happened yet.
Read 9 tweets
8 Jun
#BTC crashing?

TLDR: Short term pain, but bull phase intact.

1. $GBTC premium is -12.95%: Bearish
2. TA (daily): $22K-$39K
3. 6/25 Options: Price>$40K, bullish; Otherwise, bearish
4. Futures: Neutral-bullish
5. On-chain: Bullish
6. TA (monthly): Target: $184K-$346K in Oct '21
1/ $GBTC's premium is still double digit in the red amidst the unlock of 64M GBTC shares this month. This indicates the share unlock could contribute to downward pressure on #BTC's price.

2a/ As tweeted on 6/3/21, #BTC's price was forming a symmetrical🔺pattern. It broke out of the pattern to the downside yesterday & in the worst case, the target price is $22K.

It traded to $31K today & trend line #4 (cloned from #1) provided support & it bounced from that level. Image
Read 12 tweets
2 Jun
Since mid-April, #BTC has corrected by 53% & this coincided w/ the unlock of 90M $GBTC shares while its premium <-10% for most of the time.

Did the unlock of these shares contribute to BTC's major correction? More coming? Price floor?

TLDR: Probable. Depends. $25K-$30K in June
1/ Let's first review some background information.

Accredited investors could subscribe for $GBTC shares from the Grayscale Bitcoin Trust (Trust) at (Net Asset Value) NAV in 3 ways though there is a 6-month lock up before they could sell their shares in the secondary market.
2a/ Use cash to buy $GBTC shares at NAV

i. If the premium persists upon the 6-mo unlock, investors are able to realize the spread
ii. They can gain #BTC exposure if there's a sustained premium
iii. This's what most institutional investors did until GBTC's premium became -ve
Read 17 tweets
17 May
Amid all the gloom & doom about #BTC, let's do some in depth TA!

4-year cycle broken? V-shaped rebound? When? Seen correction low?

TLDR:

1 BTC price is tracking past cycles'
2 Price dump expected today
3 There could be a lengthening of this cycle
4 Peak price: $260K-$360K
1/ #BTC's recent price action is puzzling as it doesn't seem to follow the previous cycles'.

I was perplexed until I zoomed out & looked closely at the monthly BLX log chart to find my bearings.

BTC's price action is tracking its previous cycles'! BTC's 4-year cycle is intact. Image
2a/ I'm tracking the @HalvingTracker charts, but I've been looking at the wrong portions of the charts of previous cycles (🔵).

Using the monthly BLX log chart, I found out where #BTC is at (🔴) and where it is supposed to be in previous cycles and it all makes sense! Image
Read 10 tweets

Did Thread Reader help you today?

Support us! We are indie developers!


This site is made by just two indie developers on a laptop doing marketing, support and development! Read more about the story.

Become a Premium Member ($3/month or $30/year) and get exclusive features!

Become Premium

Too expensive? Make a small donation by buying us coffee ($5) or help with server cost ($10)

Donate via Paypal Become our Patreon

Thank you for your support!

Follow Us on Twitter!

:(