BIG #BITCOIN UPDATE! 📚
We gonna look very in-depth at the current situation discussing possibilities easy to understand even for dummies but deep enough to see hidden value
▪️ Long-term outlook
▪️ Fractals
▪️ On-chain Data
▪️ Fear & Greed
▪️ Bitcoin.Dominance
▪️ Summary
1/25
We gonna look very in-depth at the current situation discussing possibilities easy to understand even for dummies but deep enough to see hidden value
▪️ Long-term outlook
▪️ Fractals
▪️ On-chain Data
▪️ Fear & Greed
▪️ Bitcoin.Dominance
▪️ Summary
1/25
▪️ Long-term outlook
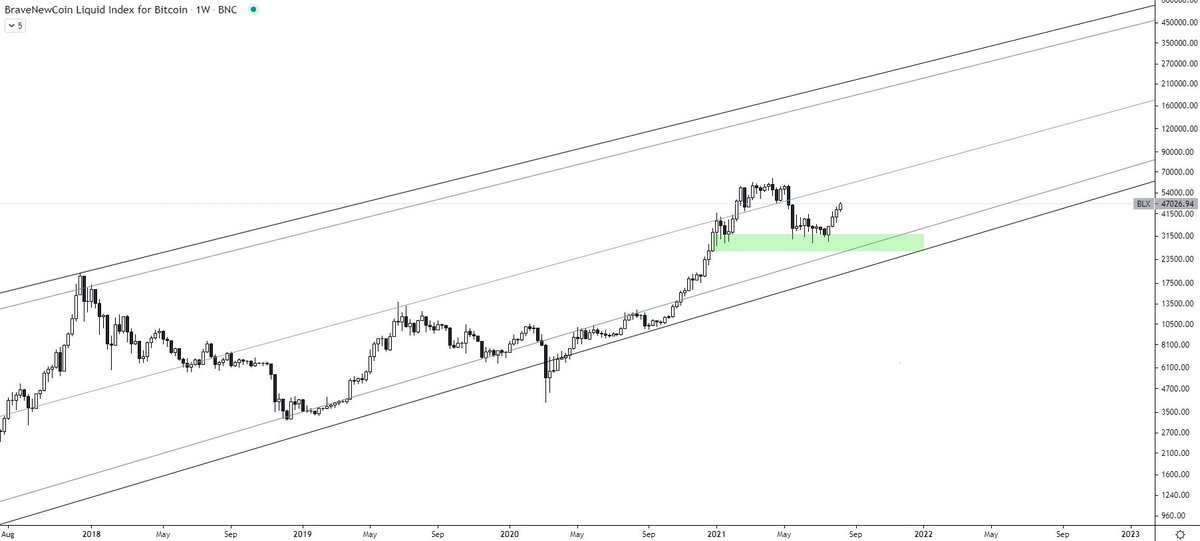
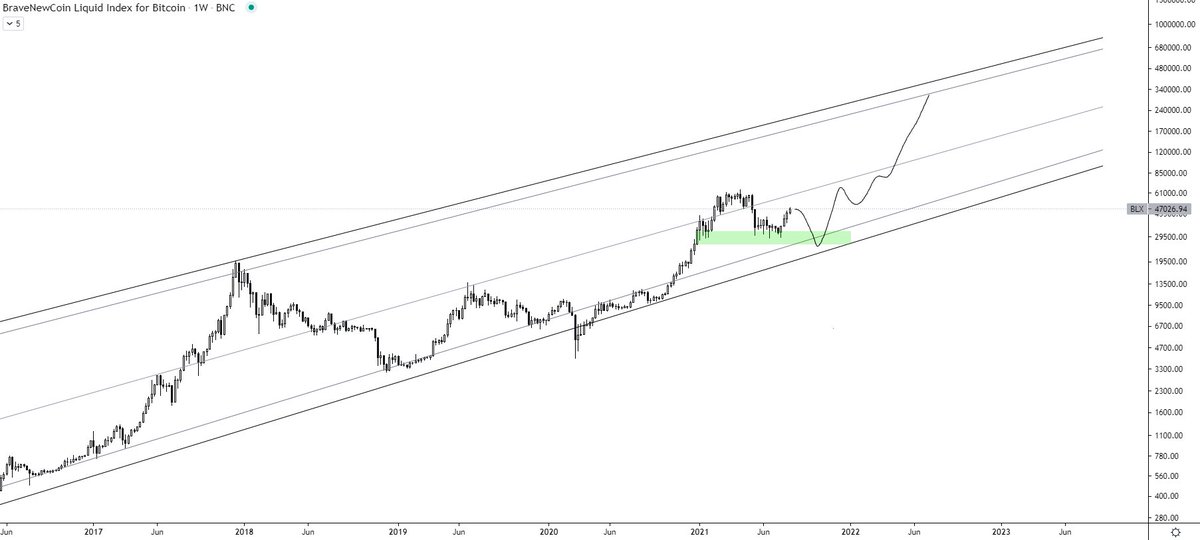
In any #Bitcoin prediction, the best thing to start with is to remind ourselves of this Monthly channel and understand we are bullish.
A logarithmic chart is the best tool to see true value trends without any clouded judgment.
2/25
In any #Bitcoin prediction, the best thing to start with is to remind ourselves of this Monthly channel and understand we are bullish.
A logarithmic chart is the best tool to see true value trends without any clouded judgment.
2/25

Any time you are gonna see anyone making catastrophic predictions, go back to this chart & remind yourself of the truth
Charts don't lie, people do
Any dips below the midpoint of the channel & 50% retracement of the current cycle have been historically a great investment
3/25
Charts don't lie, people do
Any dips below the midpoint of the channel & 50% retracement of the current cycle have been historically a great investment
3/25

This is very crucial to understand & instead of panicking & selling dips in fear, you should feel calm and try to accumulate as much #BTC / #CRYPTO here as you can.
With this in mind, there is no reason to fear any dip should it come but be ready for it.
4/25
With this in mind, there is no reason to fear any dip should it come but be ready for it.
4/25

▪️ Fractals
If you aren't sure what fractals are, I highly recommend reading this in-depth written thread.
I will go through several ones & discuss possible shorter-term possibilities.
5/25
If you aren't sure what fractals are, I highly recommend reading this in-depth written thread.
https://twitter.com/jackis_trader/status/1425911766786129921
I will go through several ones & discuss possible shorter-term possibilities.
5/25
The key thing here is the context & the timeframe.
The current move (left) is happening on a much larger timeframe scale as well as a global scale (Big institutions getting involved)
There we may take more time to accumulate here (Weeks, instead of days)
6/25
The current move (left) is happening on a much larger timeframe scale as well as a global scale (Big institutions getting involved)
There we may take more time to accumulate here (Weeks, instead of days)
6/25

The biggest fractal of the current yearly situation I see is with the #Bitcoin area around 10-12K
Important to understand, they are not the same & I see the differences, and yet, they also hold many similarities worthy of a mention.
Arrow is where we are
7/25
Important to understand, they are not the same & I see the differences, and yet, they also hold many similarities worthy of a mention.
Arrow is where we are
7/25

Zooming in, we need to align the timeframes together so that they make somewhat sense and already giving us a clear outlook however the outcome can differ slightly. Will follow later on that.
For now important to understand is that we are facing heavy resistance
8/25
For now important to understand is that we are facing heavy resistance
8/25

So what to expect from here?
The most likely scenario is we gonna see some shorter-term topping & rotation, followed by an early September crash, followed by the rest of the year bull market.
However, the outcomes can differ, and here are the options
9/25
The most likely scenario is we gonna see some shorter-term topping & rotation, followed by an early September crash, followed by the rest of the year bull market.
However, the outcomes can differ, and here are the options
9/25
Option 1) Bullish case
The price ignores the current heavy resistance and breaks through. Most likely revisit this area later on to re-balance and continues higher.
Very very bullish.
Probability: Neutral
10/25
The price ignores the current heavy resistance and breaks through. Most likely revisit this area later on to re-balance and continues higher.
Very very bullish.
Probability: Neutral
10/25

Option 2) Fractal case
Price indeed reverts here and follows to fractal at least to the drop extent. Later on, turns bullish and continues higher.
Short term bearish, long term bullish
Probability: High
11/25
Price indeed reverts here and follows to fractal at least to the drop extent. Later on, turns bullish and continues higher.
Short term bearish, long term bullish
Probability: High
11/25

Option 3) Long term channel retest
Price rejects here but doesn't find support and scares everyone to death with this big March dump fractal only to retest the long-term channel discussed in tweet (4)
Short term very bearish, long term super bullish
Probability: Small
12/25
Price rejects here but doesn't find support and scares everyone to death with this big March dump fractal only to retest the long-term channel discussed in tweet (4)
Short term very bearish, long term super bullish
Probability: Small
12/25

Such dump would be very scary but would provide a lifetime opportunity to get in cheap and probably bought back up quickly while keeping the higher timeframe bullish narrative.
Small probability but good to keep in mind.
13/25
Small probability but good to keep in mind.
13/25

The biggest difference to me in the fractals is the kind of support we are having. Back then we were straight after the bear market and had classical R turned S kind of flip.
This time we are bouncing of Yearly open.
Both are strong, yet different.
14/25
This time we are bouncing of Yearly open.
Both are strong, yet different.
14/25

▪️ On-chain Data
Over the last 30 days, we can see aggregated 180 000 #BTC exchanges outflow from centralized exchanges.
That means that entities are withdrawing their #Bitcoin to cold storage with the anticipation to hold for a long period of time.
15/25
Over the last 30 days, we can see aggregated 180 000 #BTC exchanges outflow from centralized exchanges.
That means that entities are withdrawing their #Bitcoin to cold storage with the anticipation to hold for a long period of time.
15/25

The Puell multiple has hit the bottom boundary in May and has historically been one of the best tools signaling the bottoms.
Currently up a lot so would expect a retrace.
It is calculated as Daily Coin Issuance(USD) / MA365 (Daily Coin Issuance(USD))
16/25
Currently up a lot so would expect a retrace.
It is calculated as Daily Coin Issuance(USD) / MA365 (Daily Coin Issuance(USD))
16/25

If we look at the Mayer Multiple price bands we can also visually easily see we are also at the bottom part of the accumulation channel.
The Mayer Multiple is calculated by taking the price of Bitcoin and dividing it by the 200 days moving average value.
17/25
The Mayer Multiple is calculated by taking the price of Bitcoin and dividing it by the 200 days moving average value.
17/25

Another great bullish sign is that we have seen almost the biggest weekly spot volume in the May drop right after the last year's March drop that has preceded the bull market.
18/25
18/25

▪️ Fear & Greed
Another great tool when used as a confluence.
We have been in an extreme fear situation for quite a long time, the last time we've been there was the March drop. Another confluence lining up.
However short term we are getting to Extreme greed territory.
19/25
Another great tool when used as a confluence.
We have been in an extreme fear situation for quite a long time, the last time we've been there was the March drop. Another confluence lining up.
However short term we are getting to Extreme greed territory.
19/25

▪️ Bitcoin.Dominance
Indication of #ALTs in the market compared to #Bitcoin
The chart is telling us that as long as we stay below red #BTCD is most likely to drop lower indicating further #ALTSEASON however once #BTC hits ATH I expect it to start turning around
20/25
Indication of #ALTs in the market compared to #Bitcoin
The chart is telling us that as long as we stay below red #BTCD is most likely to drop lower indicating further #ALTSEASON however once #BTC hits ATH I expect it to start turning around
20/25

▪️ Small notes under the line
If you #HODL consider reading through this IMO very valuable thread to help you make the correct plan for the future.
Once you have a plan, all you gotta do is to follow it
21/25
If you #HODL consider reading through this IMO very valuable thread to help you make the correct plan for the future.
Once you have a plan, all you gotta do is to follow it
https://twitter.com/jackis_trader/status/1369039678423379969
21/25
Right now I'm sure we are experiencing this situation.
Two takeaways. Either be patient enough for a pullback or if you buy now be mentally ready to handle the drawdown.
22/25
Two takeaways. Either be patient enough for a pullback or if you buy now be mentally ready to handle the drawdown.
https://twitter.com/jackis_trader/status/1376586049741275139
22/25
Also gotta add, this thread is sponsored by delta.exchange/jackis
It's a new promising exchange that is working very hard on updating & upgrading.
Now you have a chance to get in early and get the best bonuses (2500$) in the industry. I myself am trading there
23/25
It's a new promising exchange that is working very hard on updating & upgrading.
Now you have a chance to get in early and get the best bonuses (2500$) in the industry. I myself am trading there
23/25
▪️ Summary
The dominant trend is bullish. On-chain data shows bullish signs & we are seeing large worldwide #crypto adoption
Short term we are a bit overheated & facing resistance.
We could drop some %, however accumulating at these levels seems like the best choice.
24/25
The dominant trend is bullish. On-chain data shows bullish signs & we are seeing large worldwide #crypto adoption
Short term we are a bit overheated & facing resistance.
We could drop some %, however accumulating at these levels seems like the best choice.
24/25
Hopefully, you have found this thread valuable and it will help you make the right choices going forward.
If it did please consider sharing it with your friends & families.
Thanks for reading.
25/25
If it did please consider sharing it with your friends & families.
Thanks for reading.
25/25

Also, if you wanna see more threads & value like this defo follow these guys who share it too
@DTCcryptotrades
@DaanCrypto
@BITCOINTRAPPER
@h_bitcoiner
@Phoenix_Ash3s
@ByzGeneral
@BigCryptoT
@VEGETACRYPTO1
@CryptoLimbo_
@MacroCRG
@mark_cullen
@BitcoinPrinter
@CryptoTony__
@DTCcryptotrades
@DaanCrypto
@BITCOINTRAPPER
@h_bitcoiner
@Phoenix_Ash3s
@ByzGeneral
@BigCryptoT
@VEGETACRYPTO1
@CryptoLimbo_
@MacroCRG
@mark_cullen
@BitcoinPrinter
@CryptoTony__

• • •
Missing some Tweet in this thread? You can try to
force a refresh


