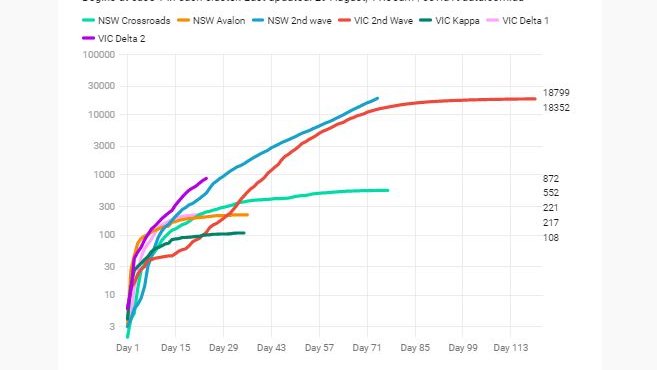
πŸ”΅πŸ¦ VIC Wild cases -

(This figure not very telling today. See Raf's tweet below - Day 13 results mean pre-isolation infectious period goes back > 2 weeks ago)

🐦 Wild: 13
🏠 Iso: 44

#covidvic #covid19vic #covid19aus

Daily Wilds -
Daily trend (7-days) -
14-day sum -

β€’ β€’ β€’

Missing some Tweet in this thread? You can try to force a refresh
γ€€

Keep Current with Juliette O'Brien

Juliette O'Brien Profile picture

Stay in touch and get notified when new unrolls are available from this author!

Read all threads

This Thread may be Removed Anytime!

PDF

Twitter may remove this content at anytime! Save it as PDF for later use!

Try unrolling a thread yourself!

how to unroll video
  1. Follow @ThreadReaderApp to mention us!

  2. From a Twitter thread mention us with a keyword "unroll"
@threadreaderapp unroll

Practice here first or read more on our help page!

More from @juliette_io

5 Sep
So many numbers swirling around this weekend about NSW hospitalisation rates

3 big questions:

1. What on earth is the hospitalisation rate in NSW?

2. How is it calculated?

3. Should Hospital In The Home (HITH) be included?

Let's go into the weeds🌱

#covid19aus #covid19nsw
Q1 - What's the hospitalisation rate in NSW?

The NSW Surveillance Report now tells us this in black and white (it just added this new piece of info last week)

In the most recent report (data to Aug 21), it says it's 11%

Two things to know about this ...
i) Think of it as 'at least 11%' b/c it doesn't account for the lag between new cases and hospitalisations. The report itself acknowledges this

ii) Dr Jeremy McAnulty confirmed yday this rate *DOES NOT* include HITH (sorry for the caps, but that's important)
Read 17 tweets
3 Sep
'case numbers will be higher, but the rate of hospitalisation will be much lower'

We're hearing this a lot. Is it happening yet? Are vaccines having a positive effect on hospitalisations?

The UK is a good example. This is what we want to see -

#covid19nsw #covid19aus #covidvic
Black dotted line = new cases
Blue solid line = hospitalisations

See how the blue curve stays low in the most recent wave, decoupling from cases in May?

'Decoupling' is the newest word in the data nerd lexicon, h/t @normanswan @teegstar πŸ€“
It's a similar picture in other countries which are on our radar as successful vaccination stories

Israel -
Read 9 tweets
1 Sep
🧭NSW LGA monster wrap πŸ‘» Cases
πŸ‘ = progress
πŸ‘ˆ = big % changes + unlinked cases

⚫️ State wrap

🦠Cases - Last 14 days, +today
πŸ“ 12 LGAs of Concern: 10734, +932
πŸ“ Western NSW: 582, +31
πŸ“ Rest of Greater Sydney: 1515, +27
πŸ“ Hunter New England: 44, +6

#covid19nsw #covid19aus
πŸ“ Mid/North Coast: 1,+0
πŸ“ Southern NSW: 3,+0

πŸ”ŽUnder Investigation - Total, +today
πŸ“ 12 LGAs of Concern: 10872,+645
πŸ“ Western NSW: 368,+9
πŸ“ Rest of Greater Sydney: 1122,+41
πŸ“ Hunter New England: 78,+1
πŸ“ Mid/North Coast: 1,+0
πŸ“ Armidale/Northern Rivers: 1,+0
πŸ“ Southern NSW: 2,-1
Read 23 tweets
31 Aug
NSW Premier said today the rate of hospitalisation is about 5.5%. She has previously said it was about 5%

Either way, this is artificially low because of the way NSW defines active cases

Short 🧡- 1/6

#covid19nsw #COVID19Aus
Today, NSW reports 17,999 active cases

That's the sum of approx. last *30 days* of cases

There are 871 people in hospital

= 4.8% hospitalisation rate

In contrast ...

2/6
VIC reports 841 active cases today

That's the sum of approx. last *13 days* of cases

There are 52 people in hospital

= 6.2% hospitalisation rate

3/6
Read 6 tweets
29 Aug
Just when I was about to have a whinge about lack of data this weekend @datansw came through with the goods at about 6pm

That means ...

🧭 It's the NSW LGA Monster Wrap πŸ‘»

Chart - LGAs of concern v Rest of Syd / NSW
*Yellow ~28 days behind blue*

#covid19aus #covid19nsw
🦠Cases (Last 14 days, +Saturday, +Sunday)

πŸ“ 12 LOCS: 9222, +1126, +746
πŸ“ Western NSW: 513, +49, +21
πŸ“ Rest of Greater Sydney: 1285, +188, +95
πŸ“ Hunter New England: 72, +7, +3
πŸ“ Mid/North Coast: 2, 0, 0
πŸ“ Southern NSW: 2, 0, 0
πŸ“ Armidale/Nthn Rivers: 0 last 14 days πŸ‘
πŸ”ŽUnder Investigation (Total, +Saturday, +Sunday)

πŸ“ 12 LOCS: 8756, +770, +668
πŸ“ Western NSW: 295, +17, +11
πŸ“ Rest of Greater Sydney: 945, +106, +72
πŸ“ Hunter New England: 74, +6, +0
πŸ“ Mid/North Coast: 1, 0, 0
πŸ“ Southern NSW: 1, 0, 0
πŸ“ Armidale/Nthn Rivers: 1, 0, 0
Read 25 tweets
29 Aug
Comparisons between current outbreaks in NSW and VIC - by request

1. Outbreak sum
2. Daily cases
3. Unlinked cases
4. Wilds

Note - VIC's July / Aug outbreaks separated into Delta 1 (pink) and Delta 2 (purple)

1. Outbreak sum -

#covidvic #covid19vic #covid19aus
1/7
Note re starting points -
Above = index case
All charts below = 10 local cases in one day

2. Daily cases -

2/7
3. Unlinked cases ('mystery' cases allocated unknown source + cases under investigation) -

3/7
Read 10 tweets

Did Thread Reader help you today?

Support us! We are indie developers!


This site is made by just two indie developers on a laptop doing marketing, support and development! Read more about the story.

Become a Premium Member ($3/month or $30/year) and get exclusive features!

Become Premium

Too expensive? Make a small donation by buying us coffee ($5) or help with server cost ($10)

Donate via Paypal Become our Patreon

Thank you for your support!

Follow Us on Twitter!

:(