I've been wanting to look at some relevant data behind the new NSW restrictions
1. Tougher measures in LGAs of concern
2. Surveillance testing scrapped
3. Mandatory outdoor masks
4. Permits for authorised workers in LGAs of concern
#covid19aus #covid19nsw #sydneyprotest
1. Tougher measures in LGAs of concern
2. Surveillance testing scrapped
3. Mandatory outdoor masks
4. Permits for authorised workers in LGAs of concern
#covid19aus #covid19nsw #sydneyprotest
1. Tougher measures in LGAs of concern (includes curfew and 1-hr exercise limit)
A few of us have been trying to show the huge Covid burden in certain communities for a while
Here's a new attempt. This chart shows daily cases in each LGA as a percentage of total cases that day
A few of us have been trying to show the huge Covid burden in certain communities for a while
Here's a new attempt. This chart shows daily cases in each LGA as a percentage of total cases that day

The big yellow one is Fairfield, Cumberland is purple, Canterbury-Bankstown is green
Below, all 12 LGAs of concern are removed
You can see in the last 5 weeks, they've accounted for about 90% of NSW cases (changed a bit recently - orange top right is Dubbo)
Below, all 12 LGAs of concern are removed
You can see in the last 5 weeks, they've accounted for about 90% of NSW cases (changed a bit recently - orange top right is Dubbo)

In contrast, here is the same sort of chart for VIC's 2nd wave
The 11 original hotspot LGAs are down the bottom
The 11 original hotspot LGAs are down the bottom

And here it is with those LGAs removed
It shows VIC's 2nd wave was more dispersed
The original hotspot LGAs made up about 60-70% of cases, and there is more variation in what remains
It shows VIC's 2nd wave was more dispersed
The original hotspot LGAs made up about 60-70% of cases, and there is more variation in what remains

This is by no means a defence of tougher measures for certain areas
The reason why NSW has *12* LGAs of concern is because Delta rolled from one into the next. Remember when we had just one?
Also, the measures raise Qs that go beyond data. But data's a good place to start
The reason why NSW has *12* LGAs of concern is because Delta rolled from one into the next. Remember when we had just one?
Also, the measures raise Qs that go beyond data. But data's a good place to start
2. Surveillance testing scrapped
This didn't come as a surprise. Here is the % of cases that were notified they were positive within 24 hours of their test. We've been watching it slip. This week it tumbled enough to trigger a change
This didn't come as a surprise. Here is the % of cases that were notified they were positive within 24 hours of their test. We've been watching it slip. This week it tumbled enough to trigger a change

CHOs said surveillance testing was useful. Without it, maybe we should focus more on how quickly people with symptoms get tested and isolate
This is a hot topic in Victoria, yet barely rates a mention in NSW
Here we can see only about half the cases meet the <1 day target -
This is a hot topic in Victoria, yet barely rates a mention in NSW
Here we can see only about half the cases meet the <1 day target -

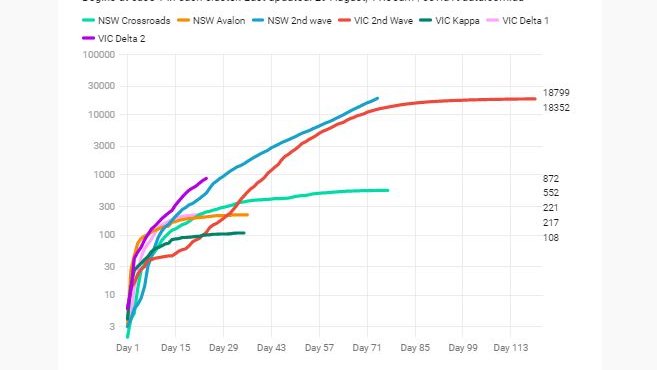
3. Mandatory outdoor masks
NSW now has an insurmountable 5,134 cases under investigation
2 months ago, we were all talking about 'fleeting transmission'. Then we stopped
Yesterday the Premier referred to it in the context of the mask requirement
This chart is on a log scale -
NSW now has an insurmountable 5,134 cases under investigation
2 months ago, we were all talking about 'fleeting transmission'. Then we stopped
Yesterday the Premier referred to it in the context of the mask requirement
This chart is on a log scale -

4. Permits for authorised workers in LGAs of concern
I'd like to dig into mobility data for this but will have to leave you with a teaser
Thanks to @hughskennedy and @f_l_o_u_r_i_s_h, we'll soon be able to visualise the mobility data by LGA produced by @liampearson
Coming soon
I'd like to dig into mobility data for this but will have to leave you with a teaser
Thanks to @hughskennedy and @f_l_o_u_r_i_s_h, we'll soon be able to visualise the mobility data by LGA produced by @liampearson
Coming soon
As always, keen to hear your thoughts about any of the above
If you want to view the live version of the first chart, it's on the Compare Outbreaks page - covid19data.com.au/compare-outbre…
Click the chart's download button for the percentage data behind it
If you want to view the live version of the first chart, it's on the Compare Outbreaks page - covid19data.com.au/compare-outbre…
Click the chart's download button for the percentage data behind it
{Correction}: Some good ppl have made constructive comments re cases under investigation. I shouldn't have connected this so exclusively to issues of masks / 'fleeting transmission'. Masks have in fact been mandatory in LGAs of concern, where most unlinked cases continue to be 🙏
• • •
Missing some Tweet in this thread? You can try to
force a refresh