tadam!
retour du nudge mortalité c-19
tautologie
deces vaxx non comptabilisé c-19...
il faut donc les deces et exces mortalité toute cause pour voir 🙈
on notera, comme d'habitude (sic), la discordance entre:
- les données vaxx (dernière date connue)
- les données décès "avec" c-19 (moyenne dernière semaine)
[et comme par hasard plus on va à l'est plus l'automne est précoce...]
du coup voyons voir France (FRA) vs Ukraine (UKR) avec les données owid de ce jour (n.b. données hospi. n.d.):
quelle surprise !
courbe "tests" et donc "positifs" en chute libre en FRA => courbes hospi. et décès suivent
tout le contraire en UKR
#CQFD
#Covid_19 #COVID19 ImageImage
notons au passage ce fait troublant: la courbe bleu des nouvelles injections (/ million) demeure ascendante en UKR avec coincidence côté courbes tests, positifs, décès.
ce phénomène coincide en FRA après le nudge #PassSanitaire de Macron du 12.07.
intéressant... ImageImage
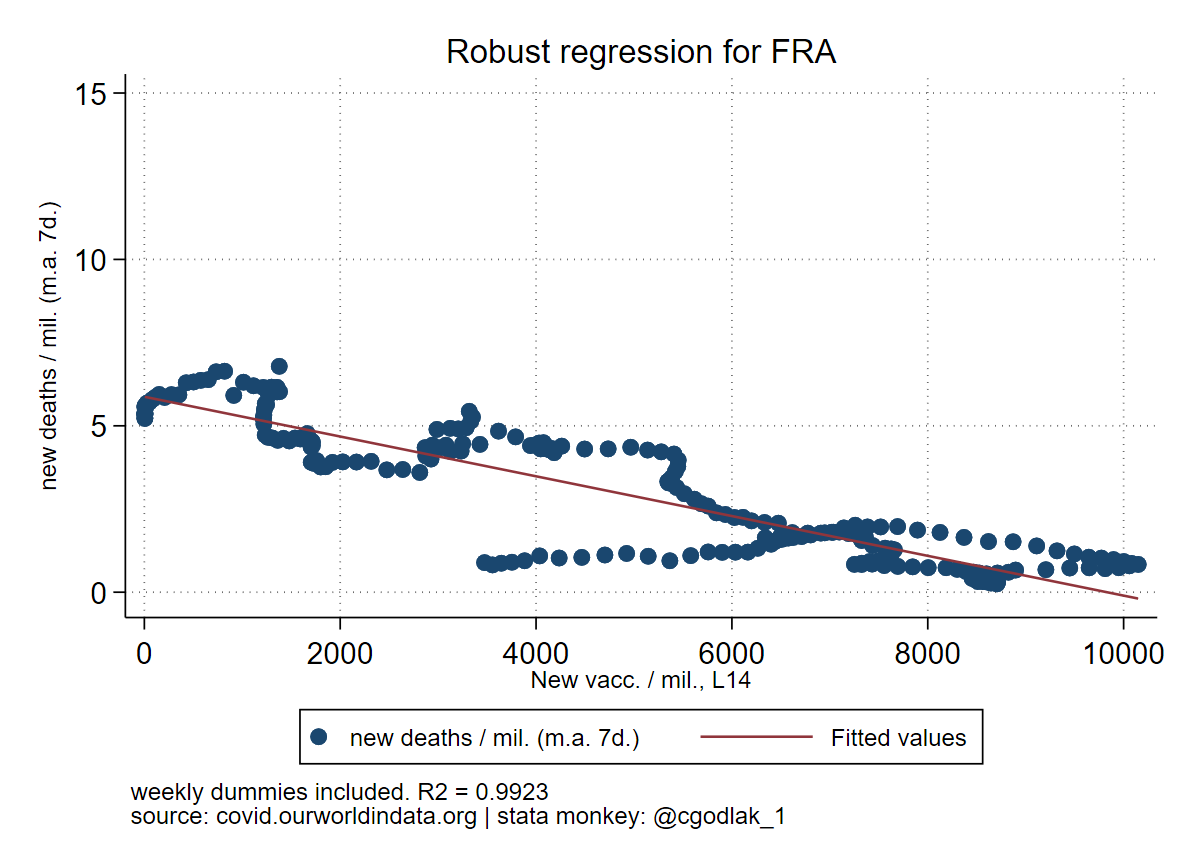
continuons dans cette voie: régression linéaire nouveaux décès sur personnes complètement vaccinés (retard 14 jours); nuage de points remontent en UKR (car + tests => + pos. => + décès) et non en FRA (car inverse)
coefficient de régression > 0 pour UKR et <0 pour FRA ImageImageImage
soit donc que sur la période 2021, une hausse vaccination complète entraine + de décès c-19 en UKR (pour 1% de plus il y a 2 semaines => + 0.25 million de décès c-19 en plus)... en FRA le coefficient est à environ -0.05...
mais voyons plutôt les nouvelles injections ci-après:
les nuages de points deviennent des serpentins avec remontée en UKR (et non en FRA) pour raisons citées auparavant. coef. de régression positif mais très faible pour UKR (+1 vaxx / million => +0.0005 million décès c-19); en France ce coefficient est NUL et non significatif ImageImageImage
moralité:
- ne pas se fier aux données @nicolasberrod du parigot (voir tweet 2)
- toujours intégrer le # de "tests" qui déterminent tout à l'avance
- réfléchir en termes de cumul de vaxx mais surtout en termes de nouvelles vaxx
#CQFD
dédicace @NiusMarco ;)
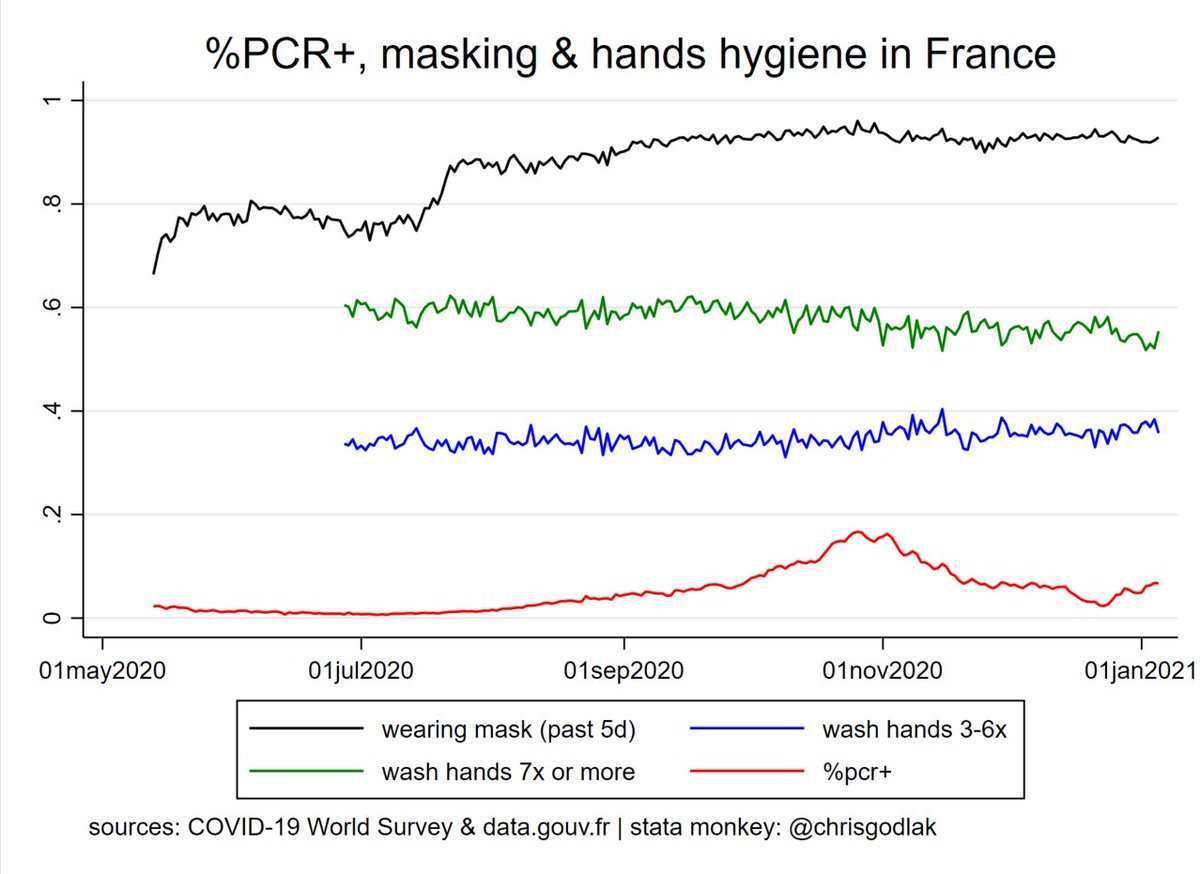
bonus, uniquement dispo. pour FRA, avec courbe mortalité toute cause (semaine 35 dispo à ce jour) en plus courbe décès "c-19" et courbes vaxx complète et nouvelles vaxx: Image

• • •

Missing some Tweet in this thread? You can try to force a refresh
 

Keep Current with Godla(j)k 🐽

Godla(j)k 🐽 Profile picture

Stay in touch and get notified when new unrolls are available from this author!

Read all threads

This Thread may be Removed Anytime!

PDF

Twitter may remove this content at anytime! Save it as PDF for later use!

Try unrolling a thread yourself!

how to unroll video
  1. Follow @ThreadReaderApp to mention us!

  2. From a Twitter thread mention us with a keyword "unroll"
@threadreaderapp unroll

Practice here first or read more on our help page!

More from @godlak_1

6 Oct
Here is the official list of #CovidVaccines manufacturers (and hence types) by country (217 locations):
ourworldindata.org/covid-vaccinat…
Here, after clicking on TABLE then DOWNLOAD, you can get the # of doses by #CovidVaccines main manufacturers injected by country
ourworldindata.org/covid-vaccinat…
This is how the shares of #CovidVaccines by manufacturer and by available country looks like on 01oct2021
#COVID19 Image
Read 11 tweets
5 Oct
Excès mortalité 2021 vs 2010-2020 en France
via @HMDatabase Image
@HMDatabase Excès mortalité 2021 en France
Ventilation par classes d'âge
85+ Image
@HMDatabase Déficit mortalité en 2021 en France: 74-85 Image
Read 6 tweets
2 May
tej wiara:)
co nam pokaza wyniki sondazy z FB na temat koronasytuacji?
dane: covidmap.umd.edu, detale: ojs.ub.uni-konstanz.de/srm/article/vi…
koronadane z covid.ourworldindata.org
jedziemy!
#koronawirus #Polska #COVID19 #thread
(tu podobny watek dot. Francji: )
1/n
Mycie nog zycia wrog a maseczki i mycie rak przestaja dzialac na jesien/zime
kto by pomyslal :p
#koronawirus #Polska #COVID19
2/n

(chcesz wiecej => t.me/chrisgodlak)
to szczegolnie przestanie lazenia po barach knajpach itp powoduje wzrost %pcr+ na jesien zime jak widac ;)
#koronawirus #Polska #COVID19
3/n
(sprawdz mnie: t.me/chrisgodlak)
Read 8 tweets
1 May
Masks & washing hands stop working in fall/winter for #COVID19 in #France

#covid19france

(data from covidmap.umd.edu, it's survey data from Facebook users, more details: ojs.ub.uni-konstanz.de/srm/article/vi…)

[t.me/chrisgodlak] Image
essential shoping (shops, groceries, pharmacies...) and "positivity" rate are two distinct and separate process :p

#COVID19 #covid19france #France

[t.me/chrisgodlak] Image
actually reducing attendance to events with more than 10 people increases %pcr+ :D

#COVID19 #covid19france #France

[t.me/chrisgodlak] Image
Read 9 tweets
30 Jan
#thread follow up to previous thread below
i repeat the same excercise with positivity rate instead of reproduction rate vs stringency index by adding country, week and both effects in the panel regressions
#COVID19
1/n
the graphs:
(notice higher positive rate when stringency stronger)
benchmark: within R² = 5.82%
+country dummies: same
+week dummies = 47.36% (~ x 100 w/r benchmark)
+country & week dum. = as above
again "seasonality" explains most of what is going on in the data
#COVID19
2/n
and so again one can ask if they #lockdown during colder seasons and this makes actually things worse ?
#COVID19
3/3
Read 5 tweets
30 Jan
#thread
Following recent success of this thread (thanks @FatEmperor i guess :)just wanted to get back to this
i will just take the first graph as exemple: it's reproduction rate vs stringency index
panel (country-time in days) regression with random effects
#COVID19
1/n
i put the initial graph as "benchmark" and i add 3 other graphs
panel regression with random effects
with countries dummies included
with weeks dummies included
with countries & weeks dummies included
and we will compare the R² as these are the only changing in this excercise
2/n
in panel regression what is most important is the R² within
adding country effects changes nothing
adding weeks (i.e. time trend or "seasonality" in this context) increases a lot the R² within (~ x100)
adding countries & weeks => same results as with weeks added only
3/n
Read 6 tweets

Did Thread Reader help you today?

Support us! We are indie developers!


This site is made by just two indie developers on a laptop doing marketing, support and development! Read more about the story.

Become a Premium Member ($3/month or $30/year) and get exclusive features!

Become Premium

Too expensive? Make a small donation by buying us coffee ($5) or help with server cost ($10)

Donate via Paypal Become our Patreon

Thank you for your support!

Follow Us on Twitter!

:(