#BTC had a 15% correction from its ATH. Is the cycle peak in?

Nope! Based on past cycles, BTC is at Wave 6 & if its low is in, BTC could be onto Wave 7๐Ÿ“ˆsoon!

TLDR:
Wave 5 Peak: $69K
Wave 6 Low: $58.6K? Lowest: ~$53K
Peak Timing: December 2021
Cycle Peak: ~$190K-$260K
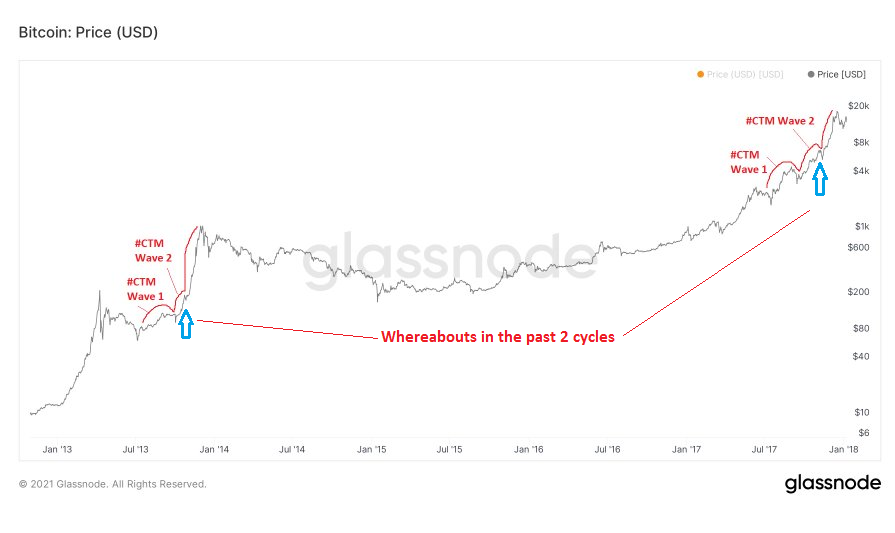
1. #BTC didn't reach its bull flag price target of $71K. As it broke Trend Line A, Wave 5 Peak (#CTM Wave 2 peak) is in.

Based on past cycles, the correction from Wave 5 to 6 is 27%-30%. As Wave 5 peak is lower than past cycles', Wave 6 low could be in. Lowest is >$53K. Why?
2. Note #BTC's Wave 6 low (#CTM Wave 2 low) couldn't be lower than Wave 3 peak (CTM Wave 1 peak), which is at $53K (~0.5 Fib ext).

After the Wave 6 correction, BTC should continue its surge to its cycle peak (Wave 7-11).

What is the cycle peak given the current price action?
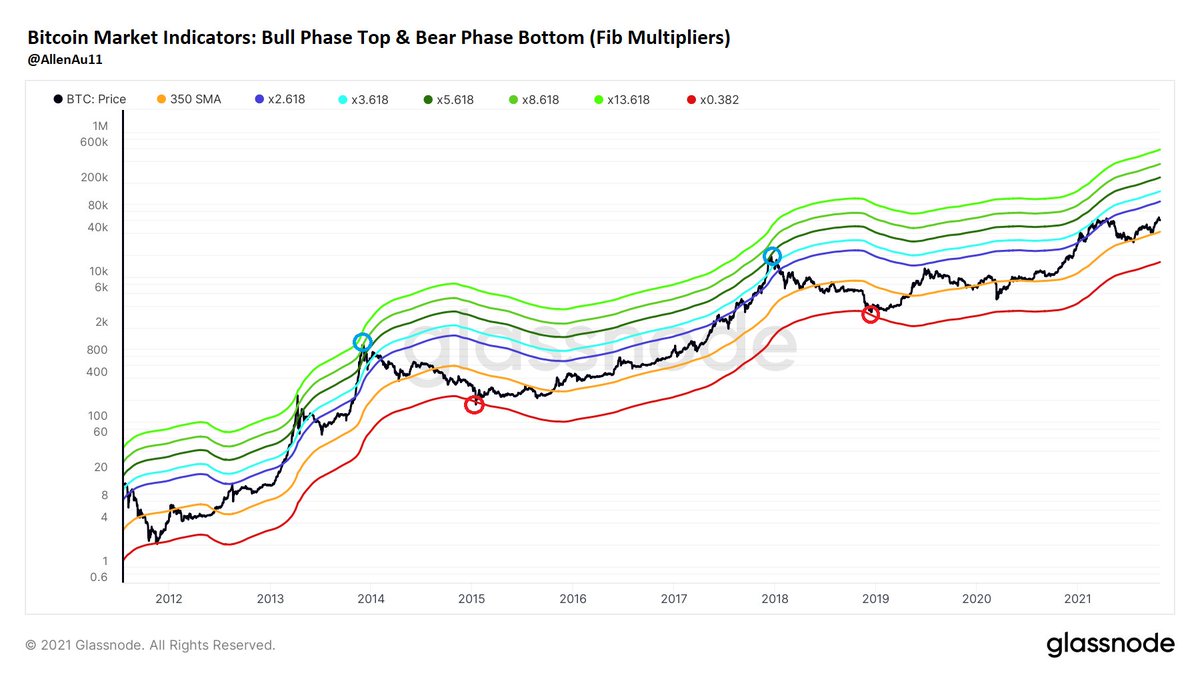
3. Based on past cycles, #BTC is on target to its cycle peak in December 2021.

In past cycles, BTC's price increased by 3.5X-4.4X from the Wave 6 low to its peak. If Wave 6 low is:

$53Kโžก๏ธPeak: $186K-$233K
$58.6Kโžก๏ธPeak: $205K-$258K

โ€ข โ€ข โ€ข

Missing some Tweet in this thread? You can try to force a refresh
ใ€€

Keep Current with Allen Au ๐Ÿงข

Allen Au ๐Ÿงข Profile picture

Stay in touch and get notified when new unrolls are available from this author!

Read all threads

This Thread may be Removed Anytime!

PDF

Twitter may remove this content at anytime! Save it as PDF for later use!

Try unrolling a thread yourself!

how to unroll video
  1. Follow @ThreadReaderApp to mention us!

  2. From a Twitter thread mention us with a keyword "unroll"
@threadreaderapp unroll

Practice here first or read more on our help page!

More from @AllenAu11

8 Nov
I will be posting a #BTC Cycle Peak Dash Board which contains information about:

1. On-chain peaking indicator
2. Countdown to projected cycle peak
3. Projected cycle peak prices & price gauges for:
a. Top Cap Model Rebuild
b. Fib Multipliers
c. BLX Model Image
Notes:
1. On-chain peaking indicators

Peaking indicator shows whether #BTC is peaking but doesn't give the timing. The closer the gauge is to 100%, the more likely BTC is peaking;

In ref. to 2017 Peak & In ref. to 2013 Peak shows how BTC performs in relation to past cycles. Image
2. Countdown to projected cycle peak

Top Cap Model Date: This is based on the no. of days elapsed between #BTC's mid-cycle correction & its cycle peak in past cycles. Est.: 12/20/21

60D VVOL Date: This is based on BTC's 60-Day Volatility. Est.: 12/29/21

Read 4 tweets
5 Nov
๐—–๐—ง๐—  #๐—•๐—ง๐—– ๐—ข๐—ป-๐—–๐—ต๐—ฎ๐—ถ๐—ป ๐— ๐—ฒ๐˜๐—ฟ๐—ถ๐—ฐ ๐——๐—ฎ๐˜€๐—ต๐—ฏ๐—ผ๐—ฎ๐—ฟ๐—ฑ: ๐—ช๐—ฒ๐—ฒ๐—ธ ๐Ÿฐ๐Ÿฏ '๐Ÿฎ๐Ÿญ

Price Action Indicators (Fundamentals that affect BTC's price)

TLDR:๐Ÿ“ˆ
1. Miner metrics- Mod. Bullish
2. Supply metrics- Bullish
3. Institution demand- Bullish
4. Network metrics- Bullish
๐Ÿญ. ๐— ๐—ถ๐—ป๐—ฒ๐—ฟ ๐— ๐—ฒ๐˜๐—ฟ๐—ถ๐—ฐ๐˜€
a. Hash Rate

Technically, the #BTC hash rate forms an ascending channel. After reaching the top part of the channel, it got rejected & is consolidating around the bottom of the channel. Let's see if will rebound from here.

Slightly bearish.
1b(i) The Hash Ribbon is a market indicator that assumes that #BTC's price tends to reach a bottom when miners capitulate & that's when BTC's price momentum switches from negative to positive- a good buying opportunity.
Read 15 tweets
4 Nov
๐—–๐—ง๐—  #๐—•๐—ง๐—– ๐—ข๐—ป-๐—–๐—ต๐—ฎ๐—ถ๐—ป ๐— ๐—ฒ๐˜๐—ฟ๐—ถ๐—ฐ ๐——๐—ฎ๐˜€๐—ต๐—ฏ๐—ผ๐—ฎ๐—ฟ๐—ฑ: ๐—ช๐—ฒ๐—ฒ๐—ธ ๐Ÿฐ๐Ÿฏ '๐Ÿฎ๐Ÿญ

๐—ฃ๐—ฒ๐—ฎ๐—ธ ๐—œ๐—ป๐—ฑ๐—ถ๐—ฐ๐—ฎ๐˜๐—ผ๐—ฟ๐˜€

TLDR: BTC's cycle peak is projected to be in Dec 2021 amidst the Fed's tapering.

BTC is en route to its cycle peak & its price may break out sharply higher soon.
The missing #BTC on-chain peak indicators๐Ÿงต๐Ÿ‘‡

๐Ÿญ๐—ฎ. ๐—ง๐—ผ๐—ฝ ๐—–๐—ฎ๐—ฝ ๐— ๐—ผ๐—ฑ๐—ฒ๐—น
This model is based on Willy Woo's Top Cap Model for tracking BTC's cycle peak. The bear phase bottom tracker is based on BTC's moving average price.

BTC hasn't peaked yet.
๐Ÿญ๐—ฏ. ๐—™๐—ถ๐—ฏ ๐— ๐˜‚๐—น๐˜๐—ถ๐—ฝ๐—น๐—ถ๐—ฒ๐—ฟ๐˜€
This model is based on Fib retracement & extension numbers as multiples of the 350D SMA of #BTC's price.

BTC hasn't peaked yet.
Read 19 tweets
24 Oct
๐—–๐—ง๐—  #๐—•๐—ง๐—– ๐—ข๐—ป-๐—–๐—ต๐—ฎ๐—ถ๐—ป ๐— ๐—ฒ๐˜๐—ฟ๐—ถ๐—ฐ ๐——๐—ฎ๐˜€๐—ต๐—ฏ๐—ผ๐—ฎ๐—ฟ๐—ฑ: ๐—ช๐—ธ๐˜€ ๐Ÿฐ๐Ÿญ & ๐Ÿฐ๐Ÿฎ '๐Ÿฎ๐Ÿญ

๐—ฃ๐—ฒ๐—ฎ๐—ธ ๐—œ๐—ป๐—ฑ๐—ถ๐—ฐ๐—ฎ๐˜๐—ผ๐—ฟ๐˜€

TLDR: BTC broke its ATH so it isn't in its bear phase as shown repeatedly here.

5 indicators show that BTC is on #CTM Wave 2 & on its way to its cycle peak.
๐Ÿญ ๐—•๐˜‚๐—น๐—น ๐—ฃ๐—ต๐—ฎ๐˜€๐—ฒ ๐—ง๐—ผ๐—ฝ & ๐—•๐—ฒ๐—ฎ๐—ฟ ๐—ฃ๐—ต๐—ฎ๐˜€๐—ฒ ๐—•๐—ผ๐˜๐˜๐—ผ๐—บ

๐Ÿญ๐—ฎ. ๐—ง๐—ผ๐—ฝ ๐—–๐—ฎ๐—ฝ ๐— ๐—ผ๐—ฑ๐—ฒ๐—น
This model is based on Willy Woo's Top Cap Model for tracking the peak & the bottom tracker is based on #BTC's moving average price.

BTC hasn't peaked yet.
๐Ÿญ๐—ฏ. ๐—™๐—ถ๐—ฏ ๐— ๐˜‚๐—น๐˜๐—ถ๐—ฝ๐—น๐—ถ๐—ฒ๐—ฟ๐˜€
This model is based on Fib retracement & extension numbers as multiples of the 350D SMA of #BTC's price.

BTC hasn't peaked yet.
Read 15 tweets
20 Oct
A tale of 3 adjoined arcs

#BTC's price action rhymes in each cycle. Using chart patterns & log fib retracement, the current rally high, point of lift-off to the cycle peak & peak price are determined.

TLDR:
Current Rally high: ~$71K
Lift-off: ~$83K
Cycle Peak: ~$250K
1a/ It is found that in each cycle around this time of the year, #BTC price will form two adjoined arcs similar to a cup & handle pattern.

The height of the smaller arc gives the price increase from the point of breakout to the rally high, which is also called #CTM Wave 2 Peak.
1b/ The height of the larger arc gives the price increase from the point of breakout to the lift-off price level, from which #BTC will rally to its blow-off top.

BTC just broke out of the smaller arc. Thus, the current rally high is ~$71K. The lift-off price level is ~$83K.
Read 4 tweets
18 Oct
#BTC has been consolidating between $59K & $63K. Breaking ATH soon?

TLDR: Yes.
Revisit or even set new ATH ~10/31/21. Max. price for this rally is $70K-$73K
Why?
-Buy & Sell Oscillator & MRGO-14: Buy
-TI: Bullish
-Futures: Bullish w/ some selling
-Options: Bullish
-TA: Bullish
1/ MRGO-14 uses the difference in changes in #BTC's market & realized price to find buy/sell signals for BTC.

Green โžก๏ธ Buy
Red โžก๏ธ Sell

MGRO-14 has flipped green since 10/4/21. Image
2/ My #BTC Buy & Sell Oscillator has been >1 since 10/5/21.

Simple
Oscillator crosses above 1โžก๏ธBuy
Oscillator crosses below 1โžก๏ธSell
Oscillator>2โžก๏ธInterim/cycle top

Advanced
Oscillator>1 &๐Ÿ“ˆโžก๏ธBuy
Oscillator>1 &๐Ÿ“‰โžก๏ธTake profit
Oscillator<1 &๐Ÿ“‰โžก๏ธShort
Oscillator<1 &๐Ÿ“ˆโžก๏ธTake profit Image
Read 13 tweets

Did Thread Reader help you today?

Support us! We are indie developers!


This site is made by just two indie developers on a laptop doing marketing, support and development! Read more about the story.

Become a Premium Member ($3/month or $30/year) and get exclusive features!

Become Premium

Too expensive? Make a small donation by buying us coffee ($5) or help with server cost ($10)

Donate via Paypal

Thank you for your support!

Follow Us on Twitter!

:(