🧵The @US_FDA's materials on @Merck's #Molnupiravir and its potential to induce problematic #SARSCoV2 variants are HERE:
📄section 4.3.2.5 (pp. 30-36)
👉fda.gov/media/154418/d…
📺at 2h51m, 3h46m, 4h5m, 5h12m, 7h32m
👉
Observations to follow.
1/n
📄section 4.3.2.5 (pp. 30-36)
👉fda.gov/media/154418/d…
📺at 2h51m, 3h46m, 4h5m, 5h12m, 7h32m
👉
Observations to follow.
1/n
@US_FDA @Merck First, @Merck and the @US_FDA panelists have done excellent work compiling and analyzing the available data. This was not an easy vote (13 YES/10 NO).
However, specifically on the potential for molnupiravir to induce new viral variants, the results only augment my concerns.
2/n
However, specifically on the potential for molnupiravir to induce new viral variants, the results only augment my concerns.
2/n
@US_FDA @Merck 1⃣MUTATION VS. SELECTION. The materials repeatedly confuse mutation and selection (e.g., "The Spike protein is already under evolutionary pressure with or without molnupiravir", 3hr).
Contrarily, the concern is this drug is a mutagen and provides RAW MATERIAL, not selection.
3/n
Contrarily, the concern is this drug is a mutagen and provides RAW MATERIAL, not selection.
3/n

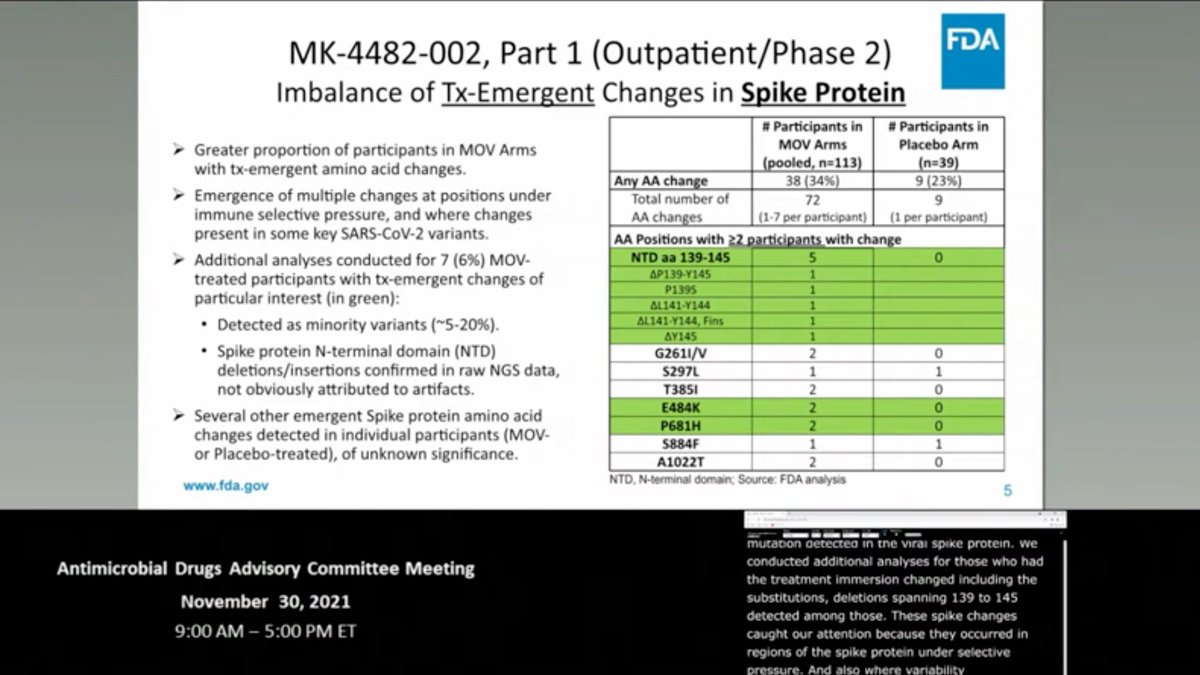
@US_FDA @Merck 2⃣PREVIOUS VARIANT OF CONCERN (VOC) MUTATIONS.
The results show molnupiravir does preferentially elevate C>U transitions, but also transversions.
Numerous VOC Spike mutations were identified in drug-treated patients—a potential problem if many take the drug (~2h50m).
4/n
The results show molnupiravir does preferentially elevate C>U transitions, but also transversions.
Numerous VOC Spike mutations were identified in drug-treated patients—a potential problem if many take the drug (~2h50m).
4/n
3⃣HOW MUCH MUTATION?
Keeping in mind molnupiravir works by inducing too many mutations, the materials repeatedly employ two MUTUALLY CONTRADICTORY lines of reasoning: (1) the drug causes too MUCH mutation for the virus; (2) the drug causes too LITTLE mutation for a variant.
5/n
Keeping in mind molnupiravir works by inducing too many mutations, the materials repeatedly employ two MUTUALLY CONTRADICTORY lines of reasoning: (1) the drug causes too MUCH mutation for the virus; (2) the drug causes too LITTLE mutation for a variant.
5/n

4⃣INDIVIDUAL VS. GLOBAL RISK.
The materials rightly note that the risk of a variant arising in ANY ONE PATIENT is low.
Of course. The issue is molnupiravir making more probable RARE EVENTS that go on to affect the GLOBE—the whole lesson of this pandemic and its variants!
6/n
The materials rightly note that the risk of a variant arising in ANY ONE PATIENT is low.
Of course. The issue is molnupiravir making more probable RARE EVENTS that go on to affect the GLOBE—the whole lesson of this pandemic and its variants!
6/n

5⃣EVOLUTIONARY PATTERN.
The materials repeatedly state that evolution with molnupiravir resembles that in nature—as if this were GOOD news!
One panelist even argues that more mutations are NOT a major problem b/c "With millions of individuals, #Omicron only popped up once"!
7/n
The materials repeatedly state that evolution with molnupiravir resembles that in nature—as if this were GOOD news!
One panelist even argues that more mutations are NOT a major problem b/c "With millions of individuals, #Omicron only popped up once"!
7/n

6️⃣The MUTATION RATE ELEVATION caused by #molnupiravir CANNOT be assessed without the raw sequence files. #bioinformatics
What some have interpreted as a ~2X rate elevation is actually POLYMORPHISM at frequency >5% in the within-host virus POPULATION, filtered by SELECTION.
8/n
What some have interpreted as a ~2X rate elevation is actually POLYMORPHISM at frequency >5% in the within-host virus POPULATION, filtered by SELECTION.
8/n

7️⃣Molnupiravir disproportionately induces TRANSITION mutations (C:G>U:A).
But transition mutations are disproportionately likely to be SYNONYMOUS (no amino acid change), and are therefore less likely to influence viral fitness and contribute to LETHAL mutagenesis.
9/n
But transition mutations are disproportionately likely to be SYNONYMOUS (no amino acid change), and are therefore less likely to influence viral fitness and contribute to LETHAL mutagenesis.
9/n

8️⃣ADHERENCE TO DRUG REGIMEN.
Even in the closely monitored trial, 5% of participants missed TWO OR MORE doses (3h59m)‼️
Incredibly, in the doc, it is suggested that early termination is an option if hospitalized—the WORST THING TO do for sublethal mutagenesis+transmission!
10/n
Even in the closely monitored trial, 5% of participants missed TWO OR MORE doses (3h59m)‼️
Incredibly, in the doc, it is suggested that early termination is an option if hospitalized—the WORST THING TO do for sublethal mutagenesis+transmission!
10/n

9⃣There was NO monitoring of FAMILY/CONTACTS, or of IMMUNOCOMPROMISED patients for viral REBOUND (~2h20m).
Moreover, assays for detecting viable virus LACKED SENSITIVITY.
Thus, we cannot assess the potential for onward spread of viable virus when taking #molnupiravir.
11/n
Moreover, assays for detecting viable virus LACKED SENSITIVITY.
Thus, we cannot assess the potential for onward spread of viable virus when taking #molnupiravir.
11/n

🔟ADAPTIVE LIMITS NOT REACHED. In a compelling presentation at 5h12m, @ismagilovlab notes that there is no evidence #SARSCoV2 has reached the limits of its (even relatively proximal) adaptive evolutionary potential.
Moreover, adaptation need not involve only Spike.
12/n
Moreover, adaptation need not involve only Spike.
12/n

🗞️CONCLUSION: we don't have sufficient data to estimate the risk #molnupiravir will cause new variants when MILLIONS take it.
As noted by panelist @JamesEKHildreth, it was incumbent on Merck to estimate this risk and they didn't.
We can only hope our concerns are wrong.
13/13
As noted by panelist @JamesEKHildreth, it was incumbent on Merck to estimate this risk and they didn't.
We can only hope our concerns are wrong.
13/13

See Virological post with @sarperotto on this issue here 👇
https://twitter.com/chasewnelson/status/1465219400064122882
Some conceptual figures illustrating our concerns are here👇
https://twitter.com/chasewnelson/status/1466722854876377093
• • •
Missing some Tweet in this thread? You can try to
force a refresh