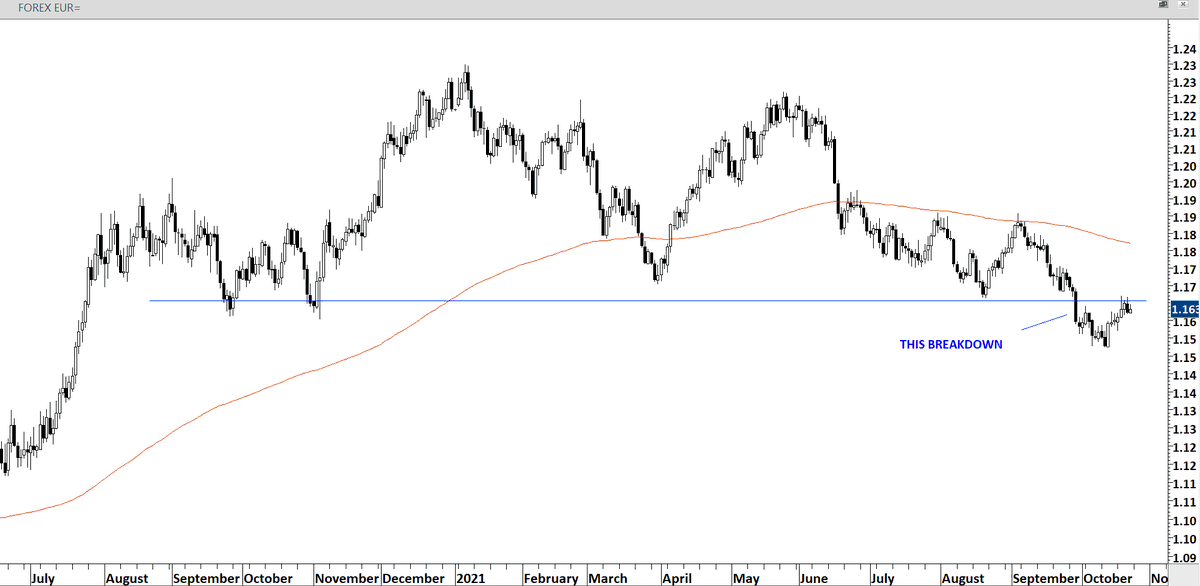
Chart patterns are confirmed when they are mature. It is usually difficult to understand at what level the pattern is mature. For me this is with several tests of pattern boundary.
First reversal signal on $BTC was covered with this setup.
Rising wedge breakdown was followed by a rebound which formed the right shoulder of a H&S top. The correction towards 30K was covered with this chart pattern setup.
Let the market give clues to the direction of the trend. We don't want to predict.
This is considered Type 2 breakout. (Explained in following videos).
Irrespective of time frame (note I don't analyze intraday price action), price dynamics are the same. Breakouts can be followed by pullbacks and those would ideally find support at the previous resistance.
Piyasada birileri..., dis gucler, soros, vs. gibi inanclari olan arkadaslar icin Isvec borsasinda islem goren bir hissenin grafigini paylasiyorum.
Piyasadaki o "birileri" ne atfedilen hareketler aslinda kolletif olarak toplu suru piskolojisi/insan davranislarindan kaynaklaniyor
Reference to earlier tweet on the price dynamics of a Type 2 breakout.