Master Thread 🧵| Index of all Twitter Threads and YouTube Videos of November and December month
Topics Covered:
Moving Averages (#MA)
Relative Strength Index (#RSI)
Trading #Divergences using RSI
#Trading #Investing #Thread #Learnings
Topics Covered:
Moving Averages (#MA)
Relative Strength Index (#RSI)
Trading #Divergences using RSI
#Trading #Investing #Thread #Learnings
Moving Averages (#MA)
Widely used indicator by traders but with a lesser understanding of what it reflects and how it should be analysed.
In this thread:
1. MA and possible use case to help you make trading decisions
2. Mean-reversion
3. Disparity
Widely used indicator by traders but with a lesser understanding of what it reflects and how it should be analysed.
In this thread:
1. MA and possible use case to help you make trading decisions
2. Mean-reversion
3. Disparity
https://twitter.com/kaushikaki/status/1459466104795893763?s=20
Learning the concept and application of Moving Averages. We have discussed the nitty-gritty of using #MA in trading
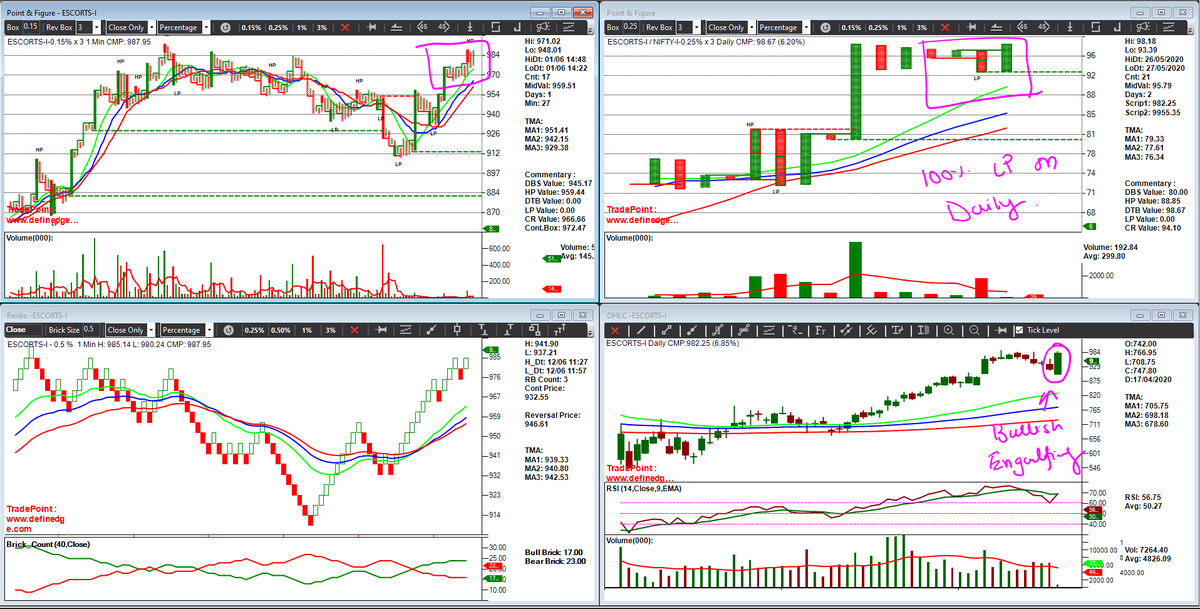
Relative Strength Index (#RSI)
One of the widely used Indicator in technical analysis by traders.
We discussed:
1. Intro and the birth of RSI
2. What info RSI indicates
3. Application of RSI with chart patterns
One of the widely used Indicator in technical analysis by traders.
We discussed:
1. Intro and the birth of RSI
2. What info RSI indicates
3. Application of RSI with chart patterns
https://twitter.com/kaushikaki/status/1467134735117922309?s=20
Trading #Divergences in RSI
In this thread, we will discuss:
1. What is Divergence
2. Why are they formed
3. Types of Divergences
4. Trading RSI Divergence
In this thread, we will discuss:
1. What is Divergence
2. Why are they formed
3. Types of Divergences
4. Trading RSI Divergence
https://twitter.com/kaushikaki/status/1469552717651656704?s=20
• • •
Missing some Tweet in this thread? You can try to
force a refresh