[Thread] 1. NEW study on how sick (or not) #Omicron makes people in SA
Full study here: bit.ly/3mo2Y2c (preprint)
Full study here: bit.ly/3mo2Y2c (preprint)

2. Cheryl Cohen @nicd_sa:
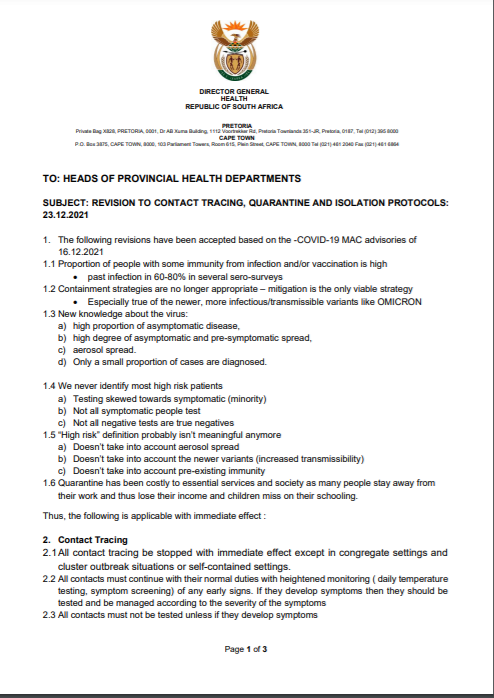
1. #Omicron emerged in SA when:
- 60-70% of people in SA had been previously infected (so they have natural immunity)
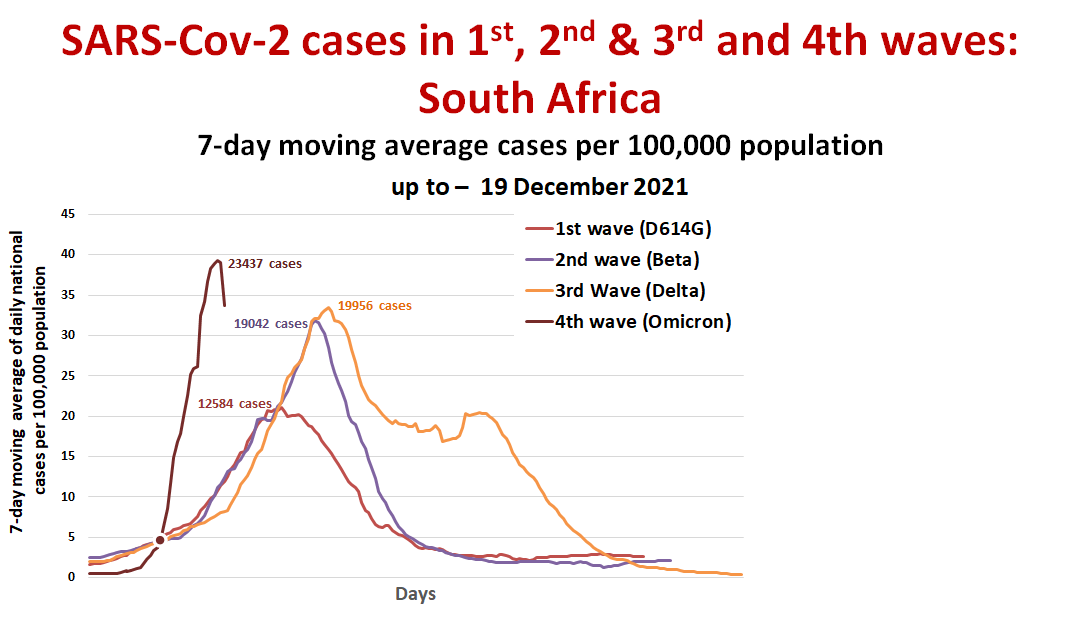
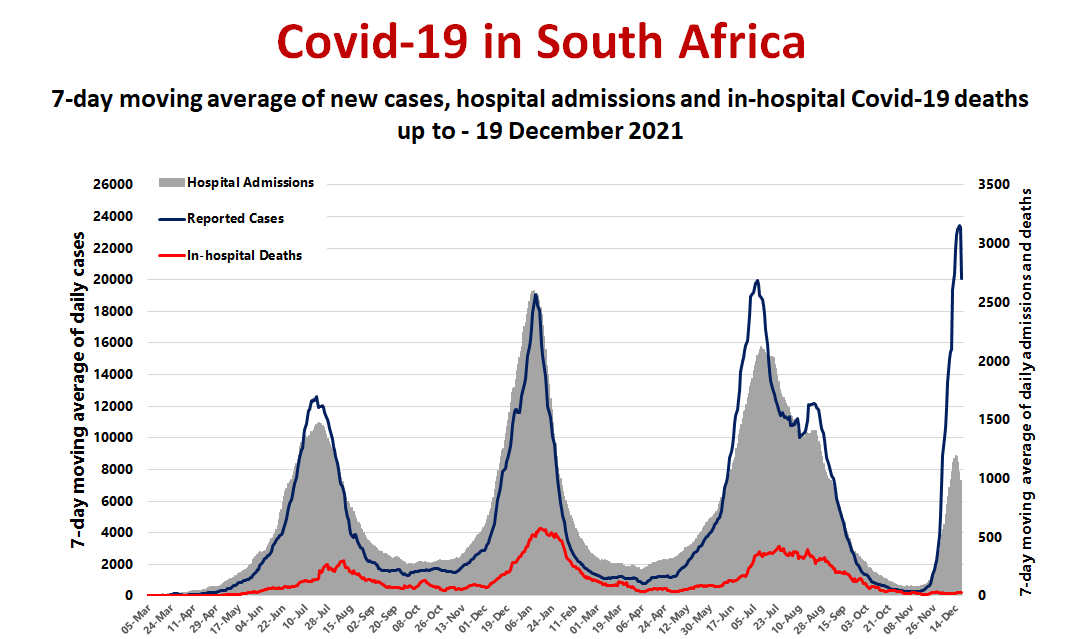
2. Early data suggest less severe disease during the Omicron period
1. #Omicron emerged in SA when:
- 60-70% of people in SA had been previously infected (so they have natural immunity)
2. Early data suggest less severe disease during the Omicron period

3. #Omicron replaced Delta VERY fast in SA - in Gauteng, where SA's Omicron outbreak started, it replaced Delta within 2 weeks (so it spreads fast). 

4. Scientists identified PCR #COVID tests of patients infected with #Omicron.
How did they know it was Omicron?
The PCR test they used looks for 3 things to tell if someone has COVID. 1 of those things = an S gene. People with Omicron normally test negative 4 an S gene.
How did they know it was Omicron?
The PCR test they used looks for 3 things to tell if someone has COVID. 1 of those things = an S gene. People with Omicron normally test negative 4 an S gene.

5. What did scientists look at?
How severe #Omicron infection is.
They compared:
1. SGTF (Omicron) infections with non-SGTF (non-Omicron) infections (1 Oct - 30 Nov)
2. SGTF (Omicron, 1 Oct-30 Nov) infections with Delta infections (April - Nov)
How severe #Omicron infection is.
They compared:
1. SGTF (Omicron) infections with non-SGTF (non-Omicron) infections (1 Oct - 30 Nov)
2. SGTF (Omicron, 1 Oct-30 Nov) infections with Delta infections (April - Nov)

6. Scientists looked at how likely people with #Omicron were to be sick enough to end up in hospital, and, if they were admitted, how likely they were to develop severe disease (end up in ICU, etc). They compared this likelihood to that of non-Omicron and Delta patients.
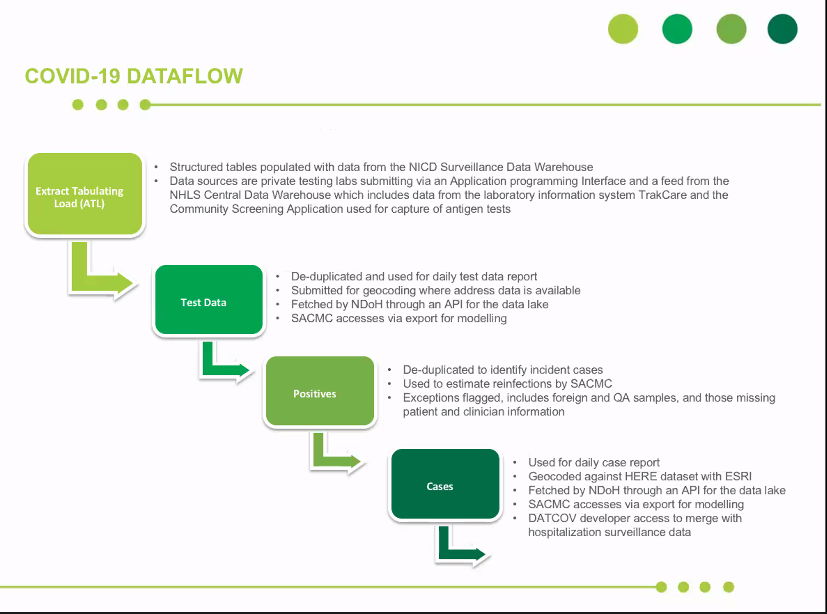
7. Where did scientists get the test and clinical (how sick they got) data of patients?
From:
1. Real-time COVID case data reported to the NICD
2. Labs (COVID test results + genome data)
2. The DATCOV-Gen network, that links genome data to clinical and hospitalisation data.
From:
1. Real-time COVID case data reported to the NICD
2. Labs (COVID test results + genome data)
2. The DATCOV-Gen network, that links genome data to clinical and hospitalisation data.
8. What were the results?
SGTF (#Omicron) infections vs. non-SGTF (non-Omicron) infections (1 Oct - 30 Nov):
1. Omicron infections = 80% less likely to be admitted to hospital than non-Omicron
2. But Omicron = same chance as non-Omicron patients to fall very ill once in hospital
SGTF (#Omicron) infections vs. non-SGTF (non-Omicron) infections (1 Oct - 30 Nov):
1. Omicron infections = 80% less likely to be admitted to hospital than non-Omicron
2. But Omicron = same chance as non-Omicron patients to fall very ill once in hospital

9. SGTF (Omicron, 1 Oct-30 Nov) infections with Delta infections (April - Nov):
Omicron infections = 70% less likely than Delta infections to develop severe disease (once admitted to hospital)
Omicron infections = 70% less likely than Delta infections to develop severe disease (once admitted to hospital)

10. Scientists also looked at something called Ct values. They tell you how much virus you've got in your body. The lower the Ct value the more virus you've got (and more infectious you're likely to be). 

11. Scientists found the Ct values of #Omicron (SGTF) infections = lower than those of non-Omicron (non-SGTF) infections. So the viral loads of people with Omicron = likely higher than those infected with other variants, which is probs why Omicron is so much more transmissible.
12. Study limitation:
- Only self-reported vaccination data was available for study participants; many many have had previous undiagnosed infection (so researchers couldn't account for this)
- Only self-reported vaccination data was available for study participants; many many have had previous undiagnosed infection (so researchers couldn't account for this)

13. The study results are for SA, so a country with high levels of previous infection and relatively low levels of vaccination. Omicron could behave very differently in countries with high vaccination rates and low levels of previous infection. 

14. What can this study not tell us? Why #Omicron causes less severe disease in SA.
3 possible reasons:
1. High levels of natural immunity
2. Better vax coverage 4 Omicron vs. Delta wave
3. Omicron = less virulent (makes people less sick)
We need more data to know the reason.
3 possible reasons:
1. High levels of natural immunity
2. Better vax coverage 4 Omicron vs. Delta wave
3. Omicron = less virulent (makes people less sick)
We need more data to know the reason.
• • •
Missing some Tweet in this thread? You can try to
force a refresh


