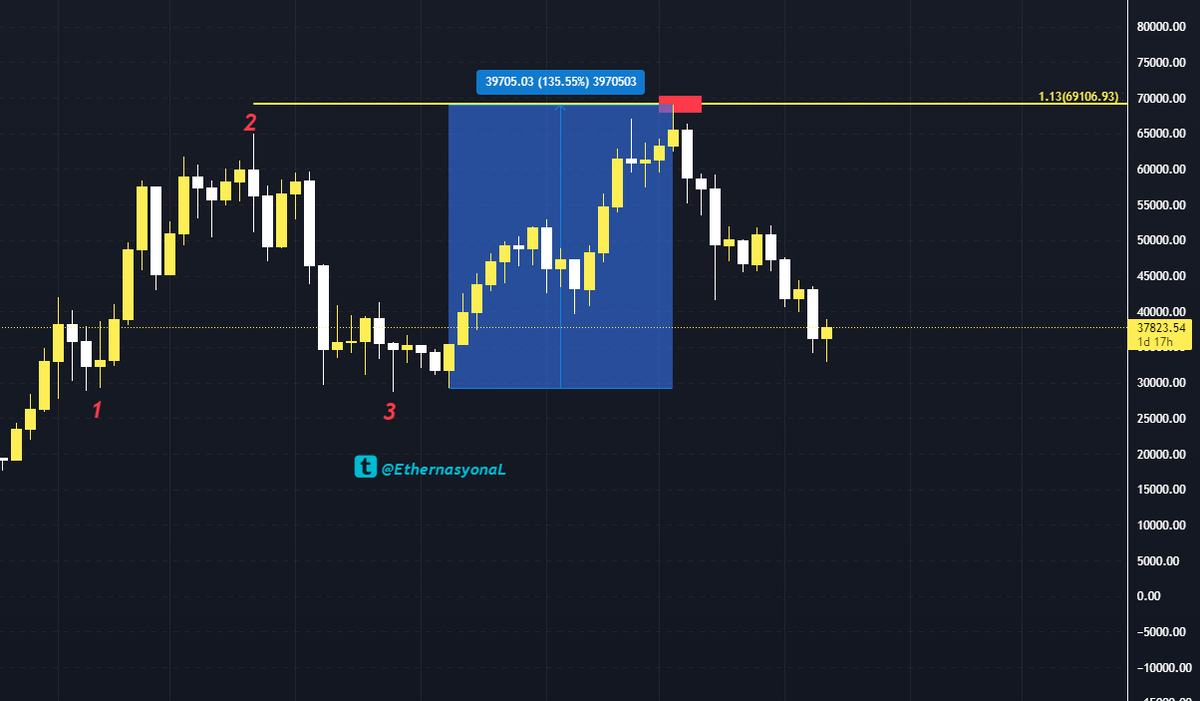
According to the #Bitcoin weekly chart (if $32900 is considered a bottom), the first major level we will be rejected is given below. ++
^^NOT INVESTMENT ADVICE^^
#Bitcoin #Btc $Btc
#Btcusd #Btcusdt
#cryptocurrency #cryptocurrencies
#Crypto #cryptocrash #cryptocommunity
^^NOT INVESTMENT ADVICE^^
#Bitcoin #Btc $Btc
#Btcusd #Btcusdt
#cryptocurrency #cryptocurrencies
#Crypto #cryptocrash #cryptocommunity

When we use the trend basis fibonacci extension tool, we see that the movement has returned from the fibonacci 1.13 level with an increase of 135.55%. ++ 

Likewise, on the other hand, when we use the trend basis fibonacci tool and take the 135.55% movement as a basis, we see the fibonacci 1.13 level ($77.812). 

Please do not take the posts as investment advice! Just my opinions on the numbers. I wish you a good weekend.
RT and like if you liked it, I would appreciate it 👌✌️
RT and like if you liked it, I would appreciate it 👌✌️
• • •
Missing some Tweet in this thread? You can try to
force a refresh


