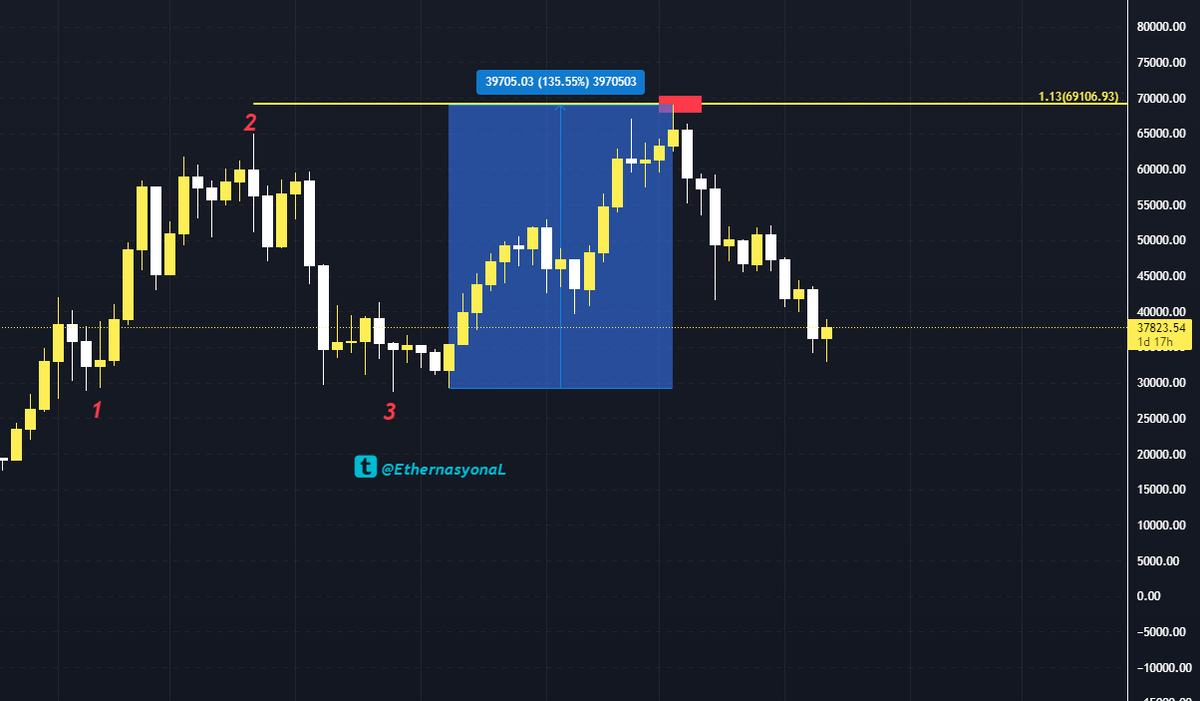
Will $33,000 remain a bottom?
Will we see a new peak in 2022? 👇++
#Bitcoin $BTC #BTCUSD
#BTCUSDT #BTCUSD #btcgbp
#cryptocurrency #Crypto #cryptocommunity
#CryptoNews #cryptocurrencies


Will we see a new peak in 2022? 👇++
#Bitcoin $BTC #BTCUSD
#BTCUSDT #BTCUSD #btcgbp
#cryptocurrency #Crypto #cryptocommunity
#CryptoNews #cryptocurrencies


As can be seen in the chart, the adventure that started after the major crash in November 2011 jumps above the moving average and reaches its peak at the end of 742 days in a parabolic fashion.
There was no closing below the moving averages until the peak. 👇++
There was no closing below the moving averages until the peak. 👇++

The adventure, which started after the big crash in August 2015, rises above the moving average and reaches its peak at the end of 847 days in a parabolic fashion.
There was no closing below the moving averages until the peak. 👇 ++
There was no closing below the moving averages until the peak. 👇 ++

The adventure, which started after the big crash in March 2020, has been tested 6 times in total by going above the moving average and we have not yet seen a close under the moving averages. 👇 ++ 

If we take the date of 29 January 2022 as a basis, the movement that started in March 2020 continues on its 686th day as of now. 👇 ++
742 days of parabolic ascent between 2011 and 2013
847 days of parabolic ascent between 2015 and 2017
There are 686 daily movements between 2020 and 2022 and still in progress
Where do you think our summit between 2020 and 2022 will end?
847 days of parabolic ascent between 2015 and 2017
There are 686 daily movements between 2020 and 2022 and still in progress
Where do you think our summit between 2020 and 2022 will end?
What is EWMA indicator?
exponentially weighted moving average.
A simple but useful dynamic volatility model, also known as riskmetrics volatility. Weighted average of past volatility and last realized return according to the selected lamp parameter. ++
exponentially weighted moving average.
A simple but useful dynamic volatility model, also known as riskmetrics volatility. Weighted average of past volatility and last realized return according to the selected lamp parameter. ++
is the name of a quality control chart. The ewma control chart is effective in detecting minor shifts at the process level. In addition to detecting this type of error, it gives us a clue about future errors.
Found by #JPMorgan . It requires less data than other models.
Found by #JPMorgan . It requires less data than other models.
• • •
Missing some Tweet in this thread? You can try to
force a refresh


