*Data use to create my #COVID19 dashboard*

covid19florida.mystrikingly.com

Friendly reminder that my dash is made possible by hard-working people at local/state/federal agencies across the country.

Below each of the 70+ viz on my site, I hyperlink the source. The major ones are:

1/
Weekly update on Florida cases, positivity, vaccinations, deaths

Includes what I use to create county-level maps and FL by age, gender, race/eth, etc.

Source: @HealthyFla

ww11.doh.state.fl.us/comm/_partners…

2/
State-level and national data on #COVID19 #hospitalizations, including current census, ICU census, admission breakdown by age group

Source: @HHSGov

healthdata.gov/Hospital/COVID…

3/
County-level #COVID19 #deaths in #Florida (updated once per week)

Source: @HHSGov Community Profile Report

beta.healthdata.gov/Health/COVID-1…

4/
State-level vaccination data used to approximate vaccination status (optimal, waning immunity from first series, partial, none) overall and by age group

Source: @CDCgov

data.cdc.gov/Vaccinations/C…

5/
County-level vaccination data - limited because I do not get manufacturer-specific numbers, so not able to do the same vax status we feel is best - instead, adopt CDC definition.

Source: @CDCgov

data.cdc.gov/Vaccinations/C…

6/
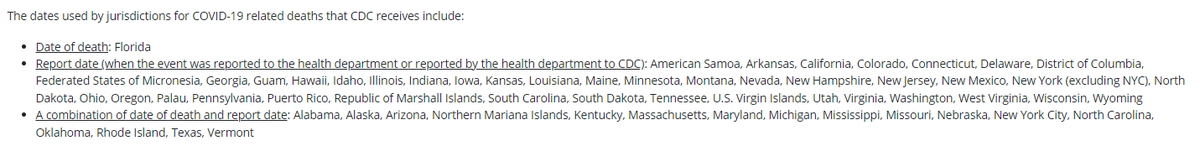
State-level daily cases and deaths, as well as construction of #Florida's deaths by date of death curve.

Source: @CDCgov

data.cdc.gov/Case-Surveilla…

7/
National, county-level data on new cases, testing/positivity, hospitalizations, vaccinations

Source: @HHSGov Community Profile Report (counties file)

protect-public.hhs.gov/datasets/cad5b…

8/
All-cause excess deaths (state-level)

Source: @CDCgov

cdc.gov/nchs/nvss/vsrr…

9/
State-level COVID-19 deaths by sex and age - I use this file to generate age-adjusted and age-specific mortality rates per capita (more fair comparison across states than crude/unadjusted rates)

Source: @CDCgov

data.cdc.gov/NCHS/Provision…

10/
National COVID-19 deaths by single year of age

Source: @CDCgov

data.cdc.gov/NCHS/Provision…

11/
Data on variants - to be honest, I just re-display two visualizations from this page on my site since there are no additional calculations that need to be performed.

Source: @CDCgov

covid.cdc.gov/covid-data-tra…

12/
These are some of the major datasets.

Obviously, I link a lot of these together, add in denominator data, calculate a bunch of different metrics from what is provided, and spend much of my effort making your interaction w the data as informative & easy-to-use as possible.

13/
The data they collect/report are the same as you encounter on my site, w some value-added goodies.

I have to clarify this every once in a while.

I don't get millions of $$ to collect data myself.

So, I rely on the hard work of federal, state, & local agency employees.

14/end

• • •

Missing some Tweet in this thread? You can try to force a refresh
 

Keep Current with Jason L. Salemi, PhD, FACE 🙈🙉🙊

Jason L. Salemi, PhD, FACE 🙈🙉🙊 Profile picture

Stay in touch and get notified when new unrolls are available from this author!

Read all threads

This Thread may be Removed Anytime!

PDF

Twitter may remove this content at anytime! Save it as PDF for later use!

Try unrolling a thread yourself!

how to unroll video
  1. Follow @ThreadReaderApp to mention us!

  2. From a Twitter thread mention us with a keyword "unroll"
@threadreaderapp unroll

Practice here first or read more on our help page!

More from @JasonSalemi

Jan 29
PLEASE do not use the @CDCgov data on deaths to compare #COVID19 #mortality per capita in #Florida to other states.

Below, I created a viz from the CDC COVID Tracker to compare 5 states. Florida is the green line and the red arrow shows a recent decrease.

1/5
Despite that suggested DECREASE in FL...

I just tweeted this out highlighting the recent INCREASE (almost a doubling) is reported COVID-19 deaths this week.


What gives?

2/5
The way in which states report mortality data to @CDCgov is not the same. Almost all report based on date reported.

FL reports by date of death

That is NOT a criticism - I like the way FL reports it so I can calc both types of curves - but it is a caution for comparison.

3/5
Read 5 tweets
Jan 27
We always talk about how #COVID19 deaths are a lagged indicator.

So far, our omicron-dominant peak in #Florida using the 7-day avg # of cases, was on 1/11/22, at >65,000 per day.

Since then, we have been on the decline, now at just under 30,000 per day.

What about #deaths?

1/
Well, over the last 5 weeks in #Florida, from 12/10/21 to 1/20/22, the number of newly reported deaths each week (daily avg) has been:

- 122 (17/d)
- 162 (23/d)
- 184 (26/d)
- 470 (67/d)
- 605 (86/d)

Tomorrow, we will get our @HealthyFla weekly report.

2/
My guess (and it is just a guess) will be that we will have learned of between 1000 & 1200 new #COVID19 deaths since the prior report.

That's in the neighborhood of 140-170 per day.

So, as expected (this is not new info), most metrics are improving, but deaths are rising.

3/
Read 10 tweets
Dec 30, 2021
Really, don't blink with this damn variant.

A few striking things I noticed, including a comparison of the #delta & #omicron surges in #Florida.

Nearly 47,000 cases reported today, 7-day avg just under 30,000.

Blows our delta peak out of the water by almost 8000/day.

🧵

1/13
We continue to lead the country in the % increase in average daily cases compared to two weeks prior.

#Florida has had a 991% increase

But the absolute increase is astonishing - we are now averaging nearly 27,000 more cases EACH DAY compared to 2 weeks ago.

2/13
Whereas only a few weeks ago, we had the LOWEST 7-day cases per capita in the country (largely due to the catastrophe that was the #delta surge)...

We're now 4th highest in the country over the last 7 days, behind only NYC, DC, and NJ.

3/13
Read 14 tweets
Dec 29, 2021
Your Dec 28, 2021 #COVID19 update

Based on today's CDC updated timeseries #, #Florida now up to 6th highest in total # of new cases over the past 7 days (766 per 100k).

NYC, DC, NJ, NY state, & RI round out a top 5 you don't want to be in.

There's a big BUT...

1/
First, the timeseries did not include the 12/27 data for any state. FL had another 29,059 new cases, increasing its 7-day average daily cases to over 25,600 (highest ever).

Second, all except 11 states have 0 cases logged for 12/26 (incomplete). So, not apples to apples.

2/
I wanted to focus on #hospitalizations.

ADULTS: New confirmed daily admissions have more than doubled in the last week alone (287/day to 581/day)

KIDS: New confirmed daily admissions have nearly tripled in the last week alone (10/day to 29/day)

3/
Read 14 tweets
Dec 26, 2021
Quick #Christmas update on #omicron in #Florida following the @HealthyFla weekly report from yesterday.

I've borrowed an image for my dashboard that reflects how it seems spread has occurred (thanks Santa).

Let's have a quick walk-through.

1/15
Here's the overview of metrics.
- cases are surging, setting daily records, approaching new record over 7 days
- more testing than ever before
- both of the above likely underestimated between at-home tests and absence of reinfections in the daily numbers
- hosps increasing

2/15
This county-level infection rate fig blows my mind.
Only 2 weeks separates the left and right maps.

I thought my home county's (Hillsborough) 507% increase was crazy.

But check out these 2-week increases:
- Dade: 1790% (19 times higher)
- Broward: 1437%
- Palm Bch: 1167%

3/15
Read 15 tweets
Dec 23, 2021
My Lord, things change RAPIDLY with #omicron.

And they are not changing for the good.

Your 12/22 #COVID19 update.

#Cases and #Hospitalizations.

As always, Florida-centric with some national context.

Brace yourselves.

covid19florida.mystrikingly.com

1/14
Purview of 7-day avg daily cases over the past 8 wks.

In the first 6 wks in this window, <2000 per day.

Last wk, 2702 per day.

Most recent wk of reported data, 10,904 per day.

# of cases in today's report (20,194) exceeded the WEEKLY TOTAL over any of the past 7 wks.

2/14
To appreciate the rapid rise, here's a map showing change in avg daily cases compared to just 2 weeks ago.

FL - 499% increase (3rd highest: DC, Hawaii)

Detailed #Florida numbers at bottom right of figure.

3/14
Read 14 tweets

Did Thread Reader help you today?

Support us! We are indie developers!


This site is made by just two indie developers on a laptop doing marketing, support and development! Read more about the story.

Become a Premium Member ($3/month or $30/year) and get exclusive features!

Become Premium

Too expensive? Make a small donation by buying us coffee ($5) or help with server cost ($10)

Donate via Paypal

Or Donate anonymously using crypto!

Ethereum

0xfe58350B80634f60Fa6Dc149a72b4DFbc17D341E copy

Bitcoin

3ATGMxNzCUFzxpMCHL5sWSt4DVtS8UqXpi copy

Thank you for your support!

Follow Us on Twitter!

:(