Our latest #explainer is on semiconductors and the global chip shortage! Here is a brief background on them 🧵
1) Semiconductor shortages have been big news since the pandemic. No single factor explains them. COVID was clearly an exacerbating factor, but the issue has been around for much longer.
2) Shortages lie predominantly in the more ‘mature’ (older generation) chip types, where investment spend is smaller and there is less incentive to increase production.
3)A semiconductor is a substance with an electrical resistivity between the very low levels of conductors and very high levels of insulators. We can change semiconductor resistivity by introducing impurities (doping). The most used semiconductor (due to its abundance) is silicon.
4) Producing a silicon chip involves:
Refining sand into silicon.
Purifying, melting, and cooling the silicon into a cylindrical crystal.
Slicing the silicon into very thin wafers (circular cross-sections).
Building a grid of rectangular/square chips onto the wafers.
5) To read our full explainer on this topic, as well as other explainers on complicated matters, head over to macrohive.com
• • •
Missing some Tweet in this thread? You can try to
force a refresh
We recently had Adam Iqbal on our podcast show. We focused mainly on FX and options. We thought we'd share with you his 'Rules of Thumb For Trading Options'.
🧵👇
1) "The best one, the one that I use every single day when I sit down the desk, really, what you need to do is just remember this one number, which is 4.2, it’s the most important number in options."
2) "So the formula for the breakeven price on a straddle is just 4.2 times the implied vol, times the square root of the number of calendar days to expiry. once you brought that number, you should make your decisions about options by just looking at a vol surface pretty quickly."
1) The Fed, the ECB and BoE are behind the curve. Normally, a tightening cycle would start during rising growth momentum. This time, however, central banks are likely to tighten as fiscal stimulus fades.
2) Markets are currently pricing four Fed hikes this year, but more might be needed to tame inflation as geopolitical risks and energy prices continue to rise.
This means the Fed might have to hike faster, suddenly slamming on the brakes throwing investors in the wind.
[1] Few things to think about on equity diversification from a brilliant academic paper we recently summarised 🗒️
The paper explores whether the liberalisation and integration of financial markets have limited...
[2] ...investors’ opportunities to diversify risk across countries. They have not.
Chart 3 shows the time-series behaviour of average corr. between countries. On avg across the 63 countries, global equity price correlation has not increased significantly over the last 40 years.
[3] Instead, correlation jumps during crises but drops after. Over the last 10 years, global interconnectedness appears to have fallen.
Where does #inflation, US Treasuries and markets go from here? John Welch shared his rather unconventional view exclusive to Macro Hive.
Given how important this is, here's a quick summary:
[1] In an era of massive QE, we cannot ignore Milton Friedman’s warning that ‘inflation is always everywhere a monetary phenomenon.’
[2] Chart 2 shows the evolution of two measures of money: 1) the monetary base (MB), comprising the monetary liabilities of the central bank, and 2) M2, which includes currency in circulation, demand deposits, time deposits, money market accounts, and other liquid deposits.
Here's a quick update on our Asia Currencies & Commodities views in partnership with @SGX, so you can keep an update on the markets that matter🐝
[1a] #China: policy easing continues. The PBoC became the first central bank to cut rates in 2022 with a 10bps cut in the one-year medium-term lending facility (MLF) to 2.85%. This was the first cut since the height of the Covid stress in March 2020. Yet $CNH remains stable.
[1b] We remain neutral on CNH given that the ongoing C/A surplus and equity inflows are offsetting declining yield support.
Awesome new IMF working paper exploring the connection between crypto and equity markets, comparing pre- and post-pandemic period - we just had to write a Hive Deep Dive summary!
Here are some key takeaways 🧵
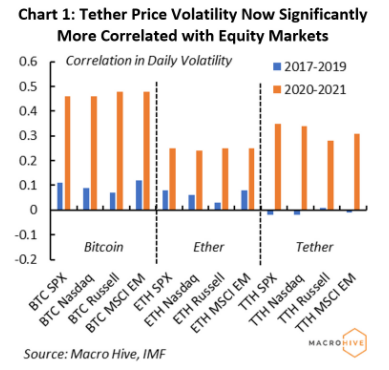
[1] Starting with simple correlations, the intra-day price #Bitcoin and #Ether, is now about 4-8 times more correlated with the volatility of the main US equity market indices (the S&P 500, Nasdaq, and Russell 2000) versus 2017-19.
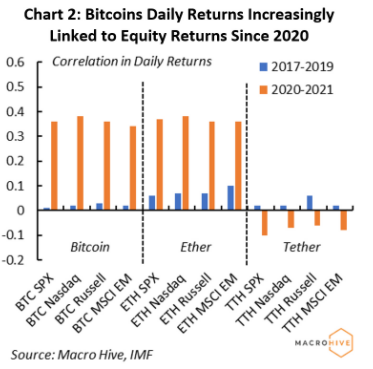
[2] Intra-day returns have also become more correlated, particularly $BTC. While the correlation between Tether & equities also strengthened, it turned negative during the pandemic – implying people used it as a risk diversification asset in that period.