
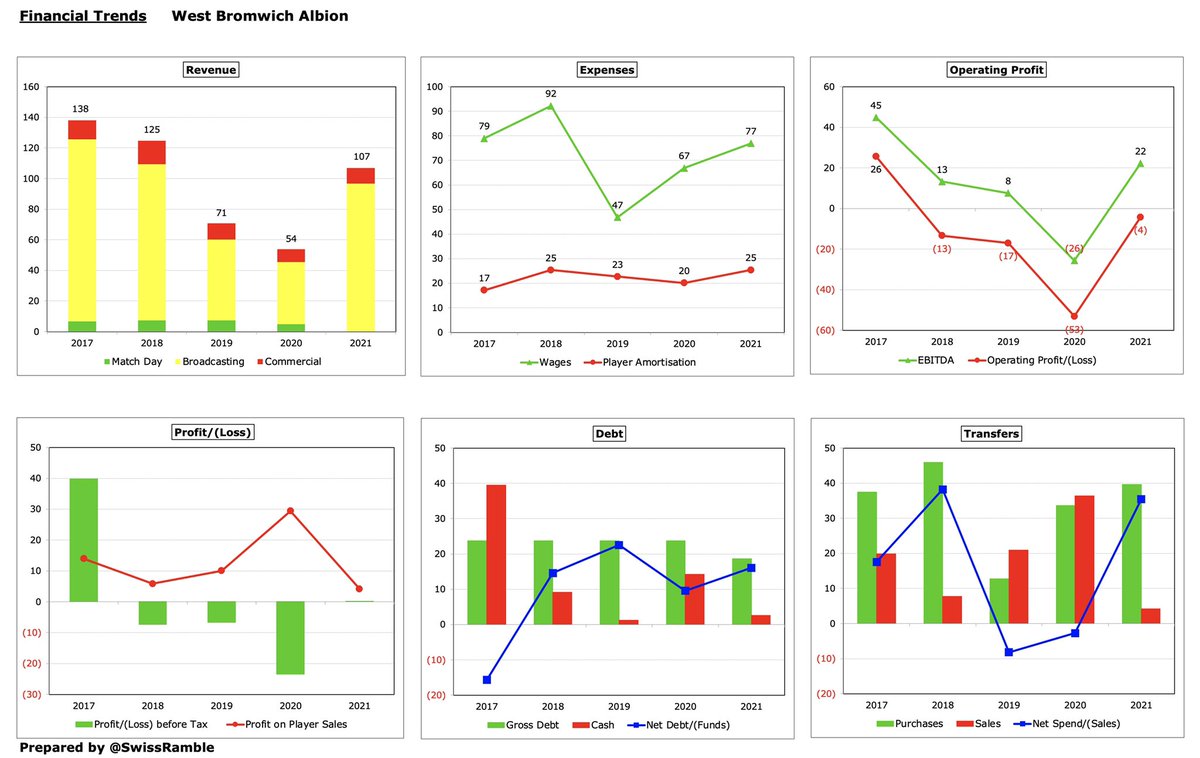
In advance of football clubs starting to publish their accounts for the 2021/22 season, I thought it might be helpful to share some 2-page financial overviews for each of the Premier League clubs for 2020/21, including a comparison against prior year and a 5-year graphical trend.
These overviews also include Premier League rankings for each of the main financial categories, e.g. which club had the highest profit, loss, revenue, wages, debt, transfer spend, etc in 2020/21.
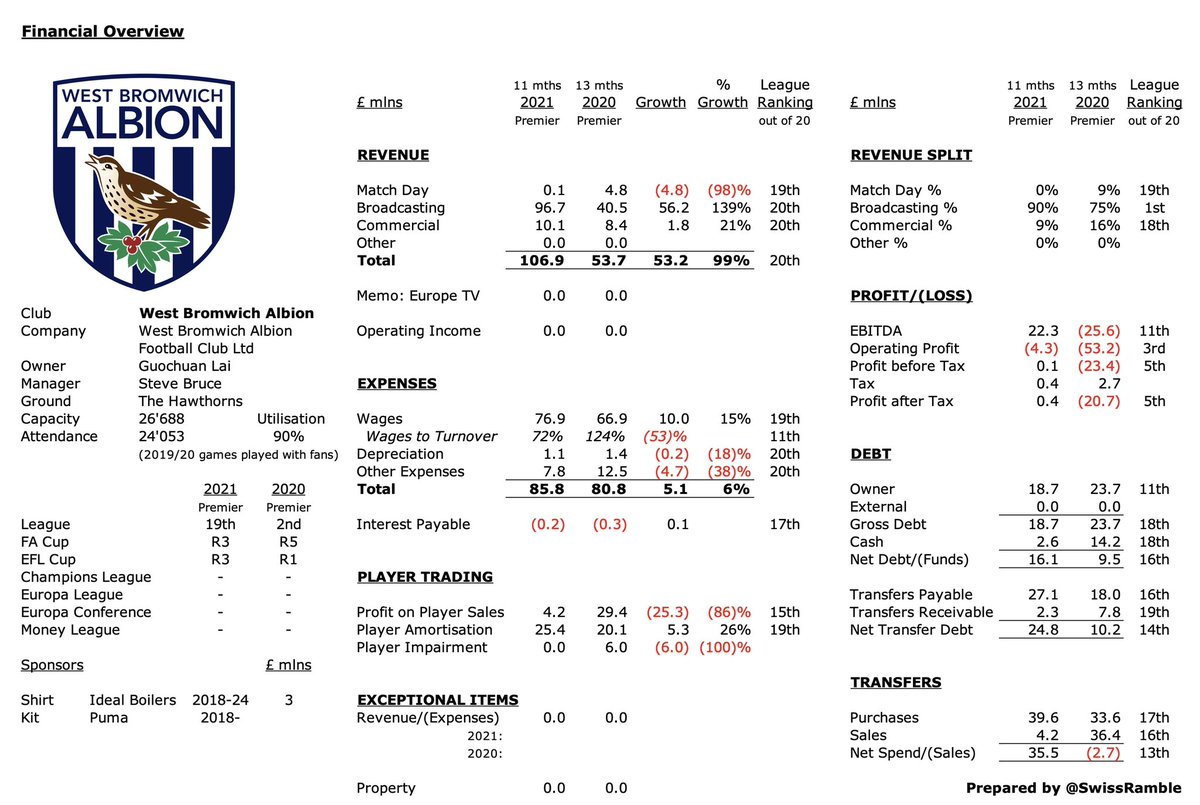
One caveat with these figures is that revenue was significantly impacted by COVID in 2020/21 with match day reduced to almost zero, as games were played behind closed doors, while some broadcasting income was deferred from 2019/20 for matches played after the accounting close.
Arsenal 2-page financial overview for 2020/21 #AFC 


Aston Villa 2-page financial overview for 2020/21 #AVFC


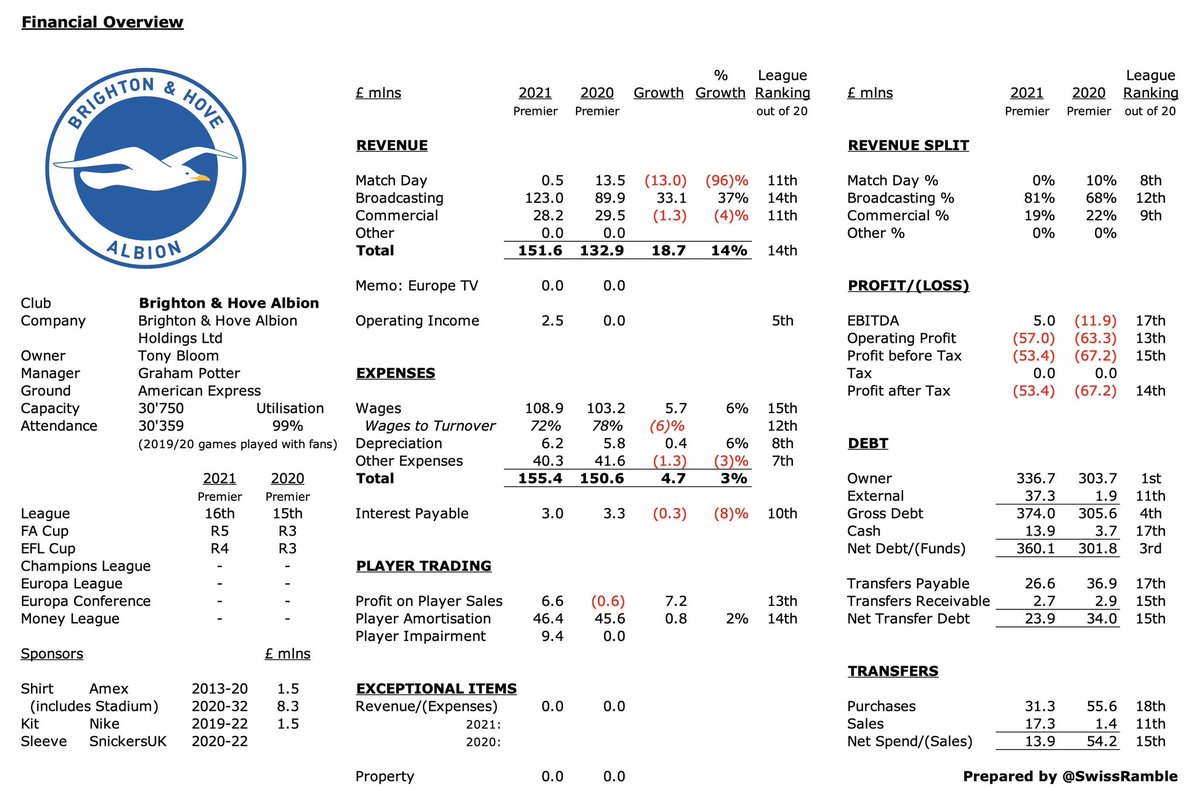
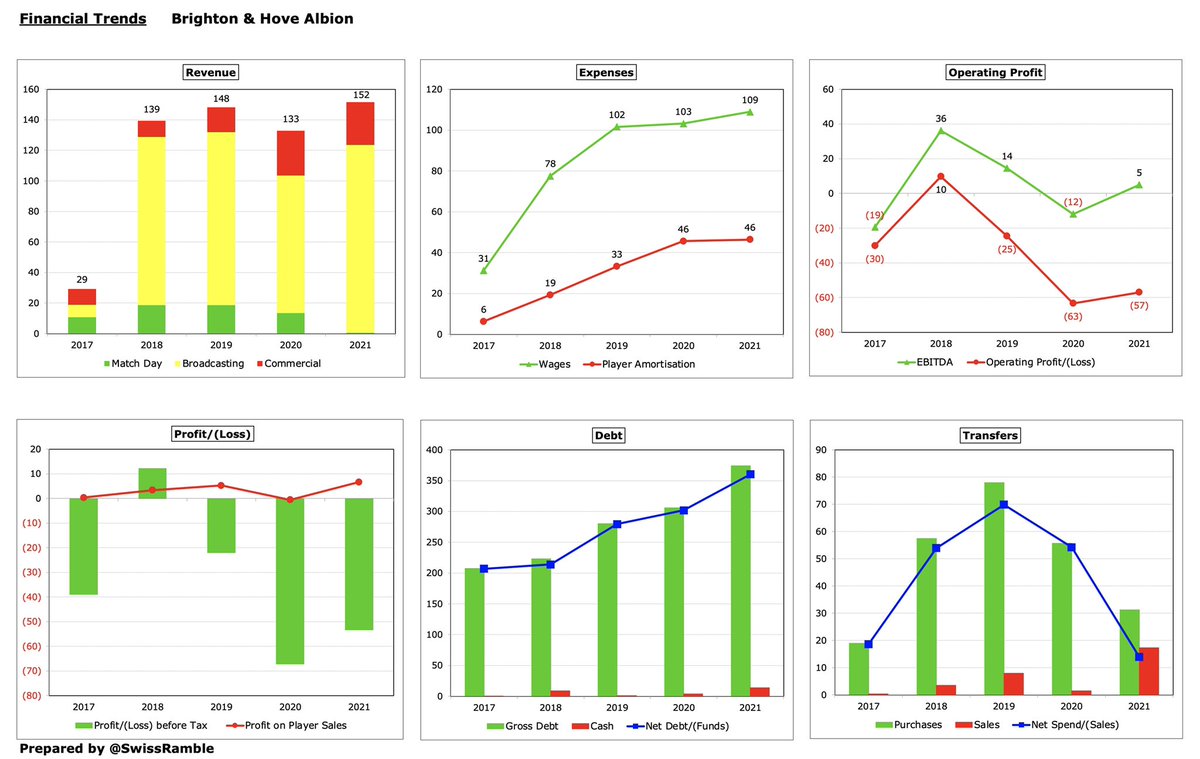
Brighton & Hove Albion 2-page financial overview for 2020/21 #BHAFC
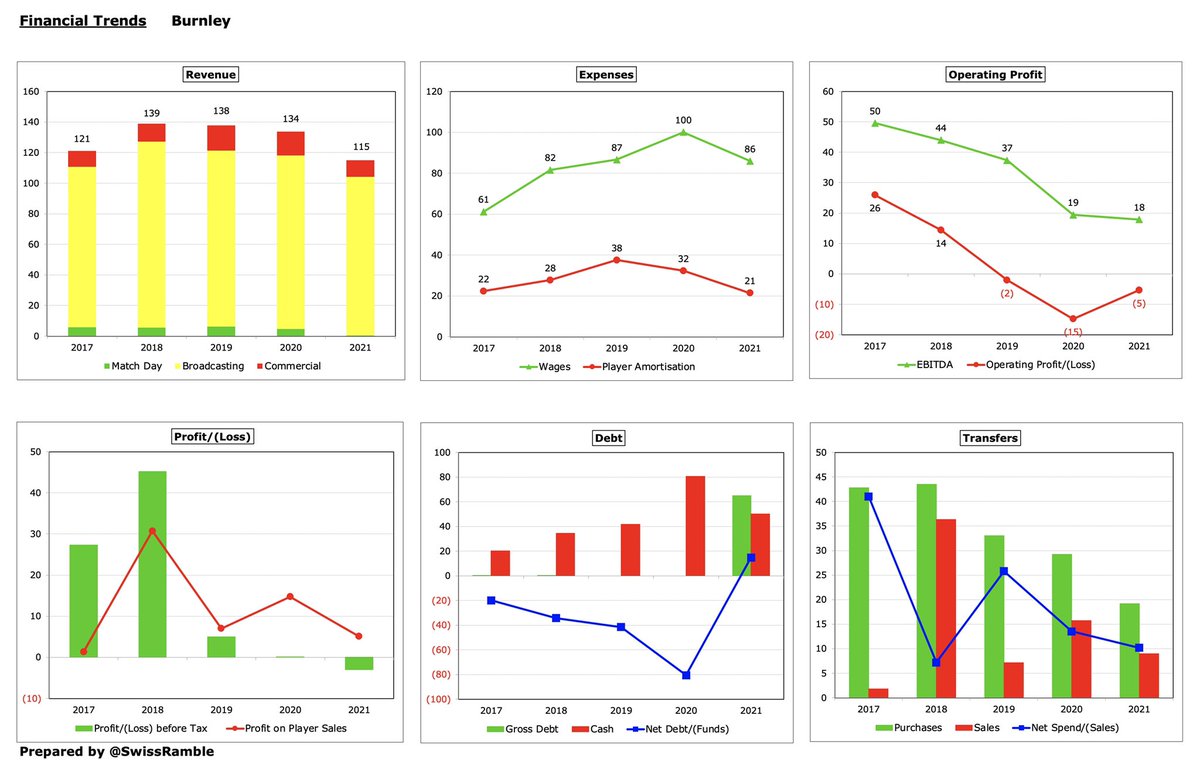
Burnley 2-page financial overview for 2020/21 #BurnleyFC

Chelsea 2-page financial overview for 2020/21 #CFC


Crystal Palace 2-page financial overview for 2020/21 #CPFC


Everton 2-page financial overview for 2020/21 #EFC


Fulham 2-page financial overview for 2020/21 #FFC


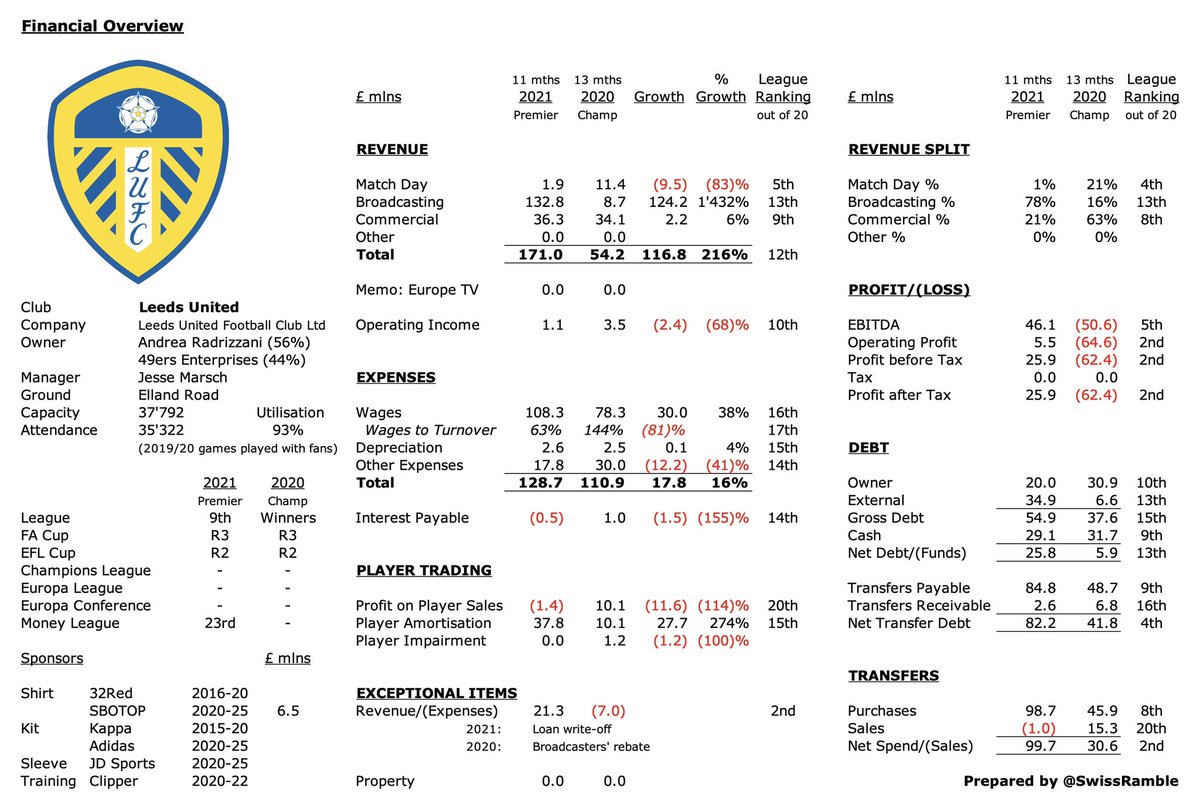
Leeds United 2-page financial overview for 2020/21 #LUFC

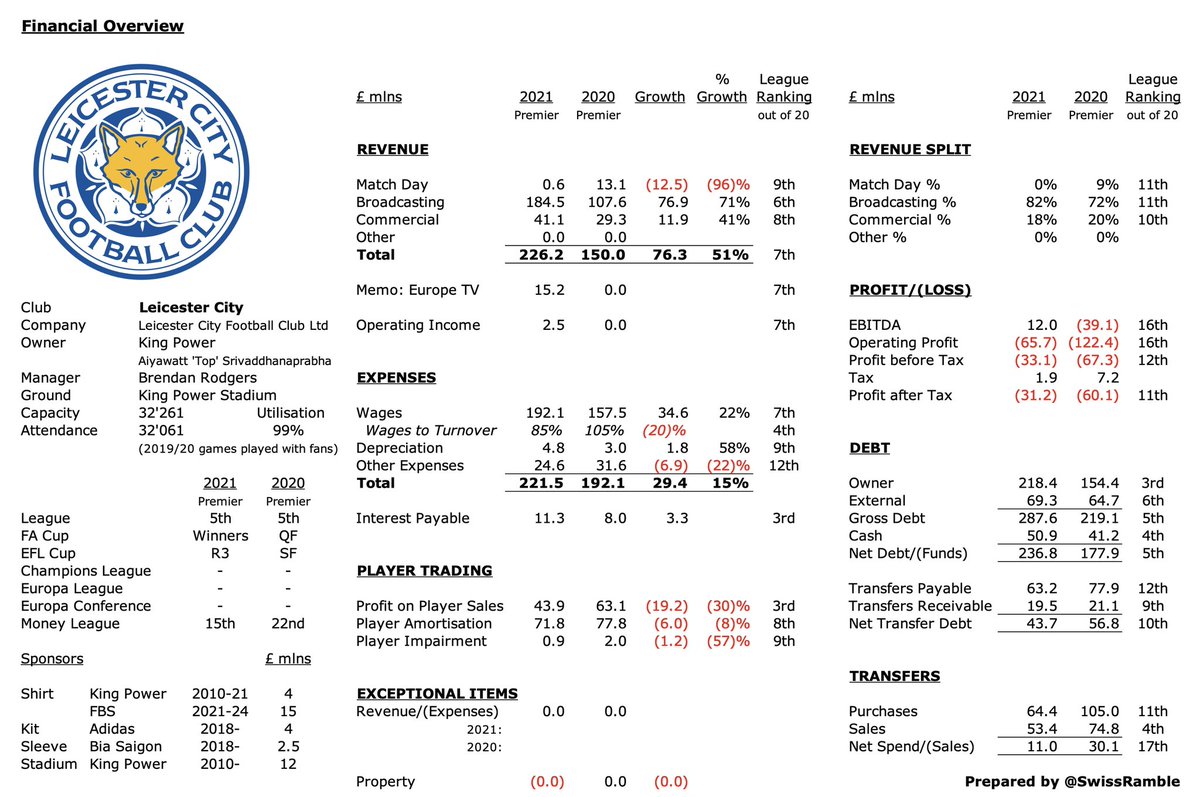
Leicester City 2-page financial overview for 2020/21 #LCFC

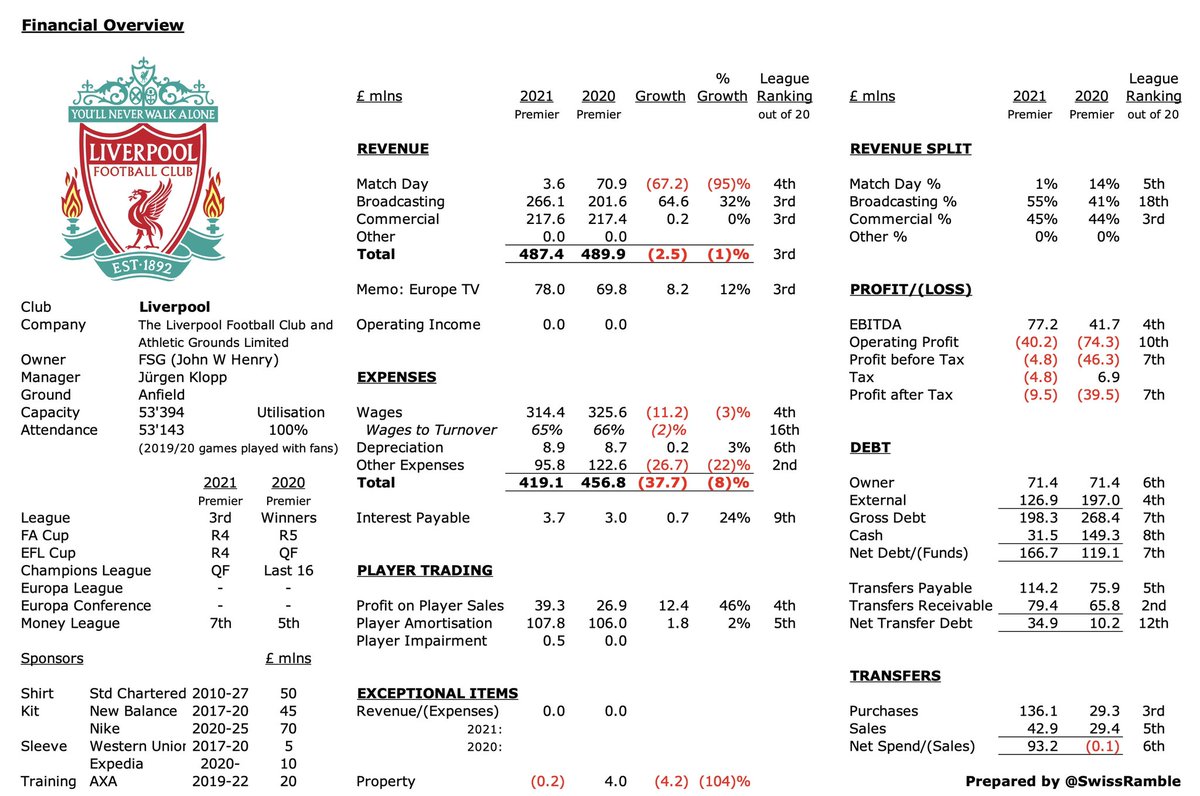
Liverpool 2-page financial overview for 2020/21 #LFC

Manchester City 2-page financial overview for 2020/21 #MCFC


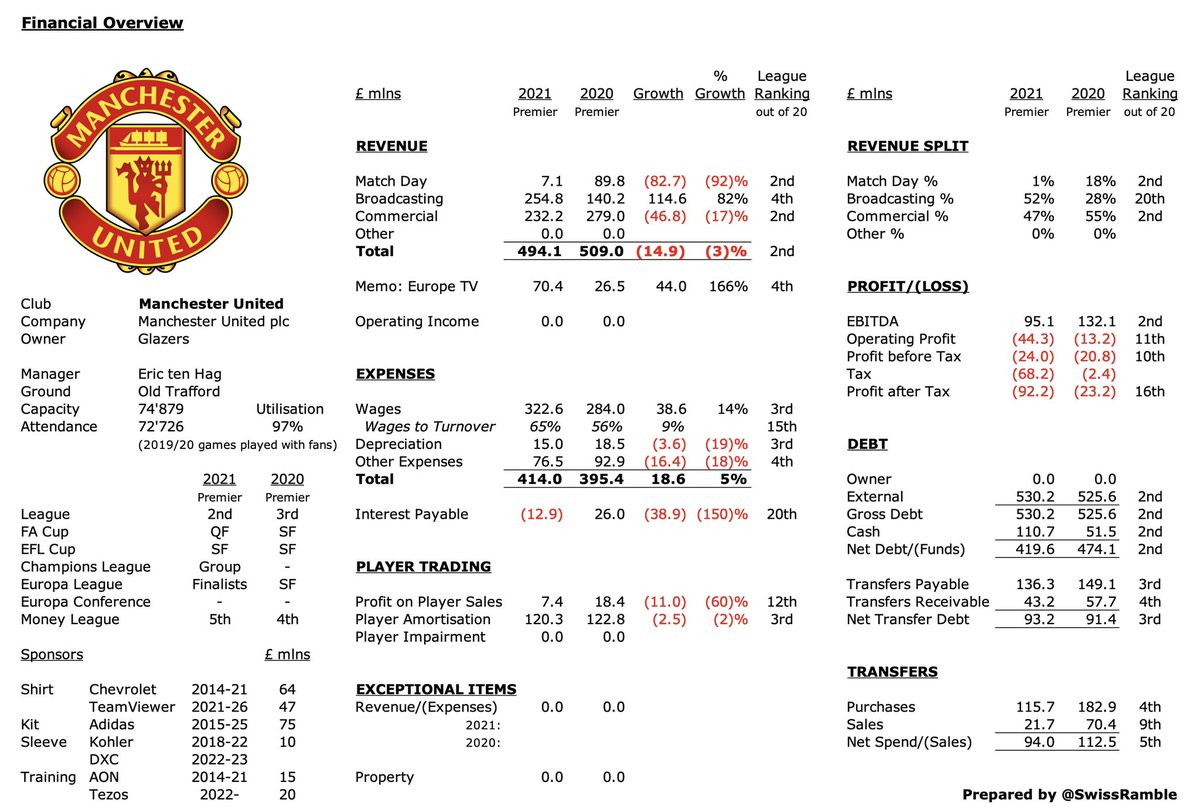
Manchester United 2-page financial overview for 2020/21 #MUFC

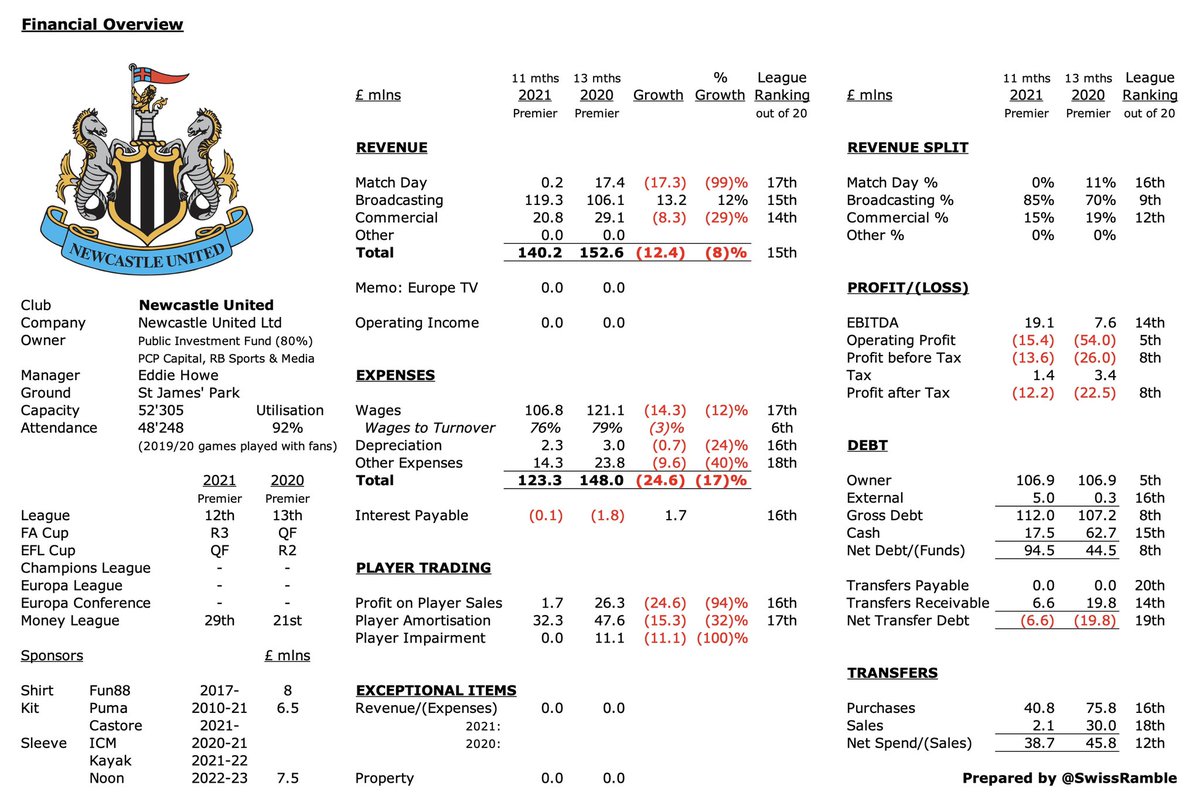
Newcastle United 2-page financial overview for 2020/21 #NUFC

Sheffield United 2-page financial overview for 2020/21 #SUFC


Southampton 2-page financial overview for 2020/21 #SaintsFC


Tottenham Hotspur 2-page financial overview for 2020/21 #THFC


West Bromwich Albion 2-page financial overview for 2020/21 #WBA
West Ham United 2-page financial overview for 2020/21 #WHUFC


Wolverhampton Wanderers 2-page financial overview for 2020/21 #WWFC


Notwithstanding the issues caused by COVID, hopefully these summaries are of some use to fans of each club.
Usual service will be resumed when clubs start publishing their accounts for the 2021/22 season.
Usual service will be resumed when clubs start publishing their accounts for the 2021/22 season.
• • •
Missing some Tweet in this thread? You can try to
force a refresh


