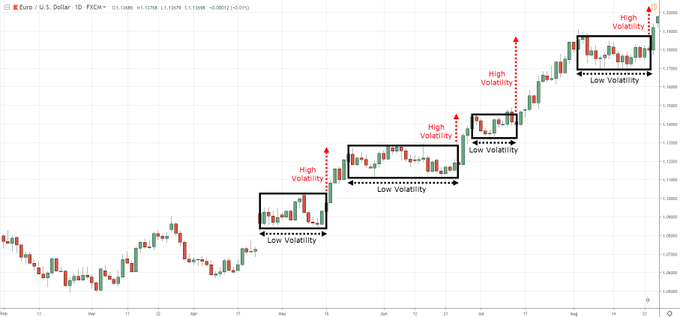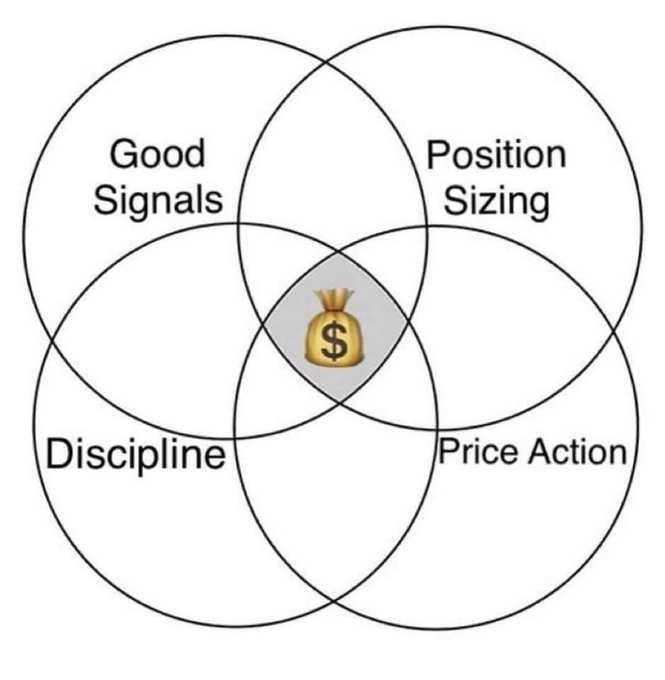
Intraday trading tips and tricks
With @Stocktwit_IN & @valuelevels
As the name suggests, Intraday Trading is the process of buying and selling stocks on the same day. Basically, you buy stocks on daily basis, you look for a reasonable price to sell it and then earn your profit.
With @Stocktwit_IN & @valuelevels
As the name suggests, Intraday Trading is the process of buying and selling stocks on the same day. Basically, you buy stocks on daily basis, you look for a reasonable price to sell it and then earn your profit.

Daily analysis and research is necessary for Intraday Trading. The movement of the market’s momentum must be reflected in the strategy used by a trader. 

It is advisable to look for liquid shares for Intraday Trading. As the trader needs to square-off their position at the end of the day, it is better to go for large cap shares. 

Do not try to move against the flow of the market. Even the people who have been trading for over a decade fail to explain and predict the situation of the market. 

Do's in Trading
You have to have a clear idea before doing anything
Manage to control your greed and fear once you get into this business.
Daily analysis and research is necessary for Intraday Trading.
Update what you are working upon with the trends in the market & implement.
You have to have a clear idea before doing anything
Manage to control your greed and fear once you get into this business.
Daily analysis and research is necessary for Intraday Trading.
Update what you are working upon with the trends in the market & implement.

Don'ts
Do not always pay heed to the rumors around you until and unless you are certain about it.
Do not plan for the future with any stock. Whatever you buy is what you would sell today
Do not always expect gains in trade.
If one gains, the other has to lose.
Do not always pay heed to the rumors around you until and unless you are certain about it.
Do not plan for the future with any stock. Whatever you buy is what you would sell today
Do not always expect gains in trade.
If one gains, the other has to lose.

Tips and Tricks for Intraday Trading
Utilizing the Stop Loss
Set your Targets
Research
Learn when to Exit
Utilizing the Stop Loss
Set your Targets
Research
Learn when to Exit

Learn more with #upstox
Start Trading & investing with UPSTOX
tinyurl.com/LinkUPSTOX
@rattibha
@threadreaderapp
@UnrollHelper
@SaveToNotion
#TradingView #stocks #nifty
#niftybank #trading #priceaction
#banknifty #niftyoptions #niftyfuture
#stockmarketindia
Start Trading & investing with UPSTOX
tinyurl.com/LinkUPSTOX
@rattibha
@threadreaderapp
@UnrollHelper
@SaveToNotion
#TradingView #stocks #nifty
#niftybank #trading #priceaction
#banknifty #niftyoptions #niftyfuture
#stockmarketindia
• • •
Missing some Tweet in this thread? You can try to
force a refresh


