Why does the #bonds crash signal further pressure for #stocks?
(& why do rate hikes take so long to show in earnings?)
High inflation & rate hikes transmit through the economy with a range of 1st to 3rd order effects with varying lags. Lets map those out:
PART 1 of 2 threads:
(& why do rate hikes take so long to show in earnings?)
High inflation & rate hikes transmit through the economy with a range of 1st to 3rd order effects with varying lags. Lets map those out:
PART 1 of 2 threads:

This is complicated to map given various dynamics, sectors & lags, particularly with 280 char limits! But lets give it a go anyway. This is descriptive to help you think through aspects & trades you may not have yet considered
Theres 2 PARTS to this thread due to length
Theres 2 PARTS to this thread due to length
Direct impacts:
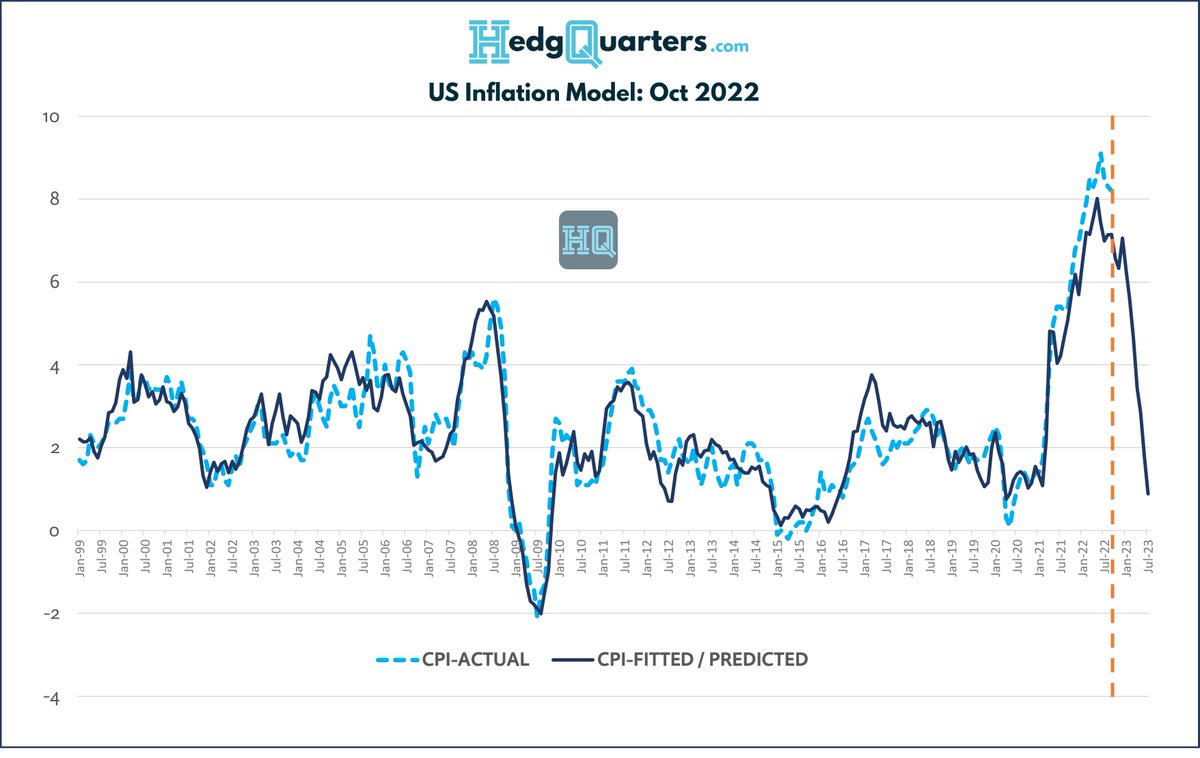
When rates are hiked in response to #CPI, theres 2 1st order effects that are fairly contemporaneous. First #bond prices fall as they are the direct inverse of their rate. Higher Fed Funds, higher rates across the curve, lower bond prices
h/t @leadlagreport chart
When rates are hiked in response to #CPI, theres 2 1st order effects that are fairly contemporaneous. First #bond prices fall as they are the direct inverse of their rate. Higher Fed Funds, higher rates across the curve, lower bond prices
h/t @leadlagreport chart

The speed and magnitude of this hike cycle has seen record bond losses for that reason. We havent seen this steepness of hikes since the ‘70s. The mkt is pricing ~450bps of FFR hikes from March to Dec ’22.

The other direct effect of rates that transmits fairly contemporaneously is on the cost of capital. With the market P/E ratio essentially the inverse of the cost of equity, we’ve seen #stocks fall primarily due to P/E contraction, not earnings

Lagged impacts:
Earnings so far have been fairly resilient, which has some #investors calling for a 4Q rally. But this is just a timing issue as I’ll take you though. You’ve heard it said that rates impact with a 12 or so month lag (some say 18mths). The following is why…
Earnings so far have been fairly resilient, which has some #investors calling for a 4Q rally. But this is just a timing issue as I’ll take you though. You’ve heard it said that rates impact with a 12 or so month lag (some say 18mths). The following is why…

2nd / 3rd order effects
There are early cycle industries that are more sensitive to rates than others & that are very important to the economy. Housing is chief amongst these.
HOUSING: As seen in the leading NAHB index, housing market conditions are now deteriorating fast.
There are early cycle industries that are more sensitive to rates than others & that are very important to the economy. Housing is chief amongst these.
HOUSING: As seen in the leading NAHB index, housing market conditions are now deteriorating fast.

Theres been a 4 std dev fall over 6 mths in the NAHB index. That is extremely rare.
Rate hikes first affect borrowers’ ability to obtain mortgages. As tweet below shows, mortgage affordability at 7% rates eventually precipitates sharp falls in home prices
Rate hikes first affect borrowers’ ability to obtain mortgages. As tweet below shows, mortgage affordability at 7% rates eventually precipitates sharp falls in home prices
https://twitter.com/andycwest/status/1581764755328729089?s=20&t=uMp5Oqvfpa5i07koVlPRQg
But these also take time.
While the banks are offering you less mortgage $ now, sellers, anchored by past prices, take time to accept lower bids.
But over 9 mths+, the needs of moving, work relocation, deaths, divorces, mortgage stress etc force sales to occur & prices fall.
While the banks are offering you less mortgage $ now, sellers, anchored by past prices, take time to accept lower bids.
But over 9 mths+, the needs of moving, work relocation, deaths, divorces, mortgage stress etc force sales to occur & prices fall.

Mortgage stress builds slowly. Only ~10% of mortgages are variable in US. So the rate hikes affect those people & accumulate each month. A certain % of mortgages are also refinanced each year at the new rates. Mthly payments rise but savings buffer for a while before demand falls
BUILDING:
As house prices fall, building activity slows. But as builders have order backlogs, this typically takes 9-12 mths to work through, lagging the impact on activity. New renovation & build permits fall first eventually coming through home builder earnings in 12 mths
As house prices fall, building activity slows. But as builders have order backlogs, this typically takes 9-12 mths to work through, lagging the impact on activity. New renovation & build permits fall first eventually coming through home builder earnings in 12 mths
The first sign is the drop in NAHB Buyer traffic indicators, followed by reported Home Builder new sales (eg $TOL $PHM ).
As shown below, buyer traffic has been falling since first rate hikes in March this year
As shown below, buyer traffic has been falling since first rate hikes in March this year

The building industry is a major employer and flow on demand to other consumption magnifies its economic contribution. A direct 4% of GDP from resi building increases to about 8%+ of GDP once you add in related demand. Construction workers are also about 5% of total labour force
So as activity declines in building, after about 9 months from the first hike, there is direct impact on that industry's EPS, indirect impact to sectors that derive demand from housing and layoffs of construction workers that reduce demand for consumer goods due to lower income.
HOUSING GOODS / CARS:
As home equity & housing turnover falls over 12 mths from hikes starting, so too do purchases of fixtures, furnishings, home electronics as these are often timed with buying or renovating a home.
So we start to see EPS cuts in hard goods sectors mount
As home equity & housing turnover falls over 12 mths from hikes starting, so too do purchases of fixtures, furnishings, home electronics as these are often timed with buying or renovating a home.
So we start to see EPS cuts in hard goods sectors mount
Automobile purchases are often tied to this same cycle as well given auto finance costs rise and car purchases often use home equity (falling) or are catalyzed by moving.
Companies exposed to automotive demand then also see EPS cuts mount at this time...
Companies exposed to automotive demand then also see EPS cuts mount at this time...
That ends part 1 of this thread. Look out for Part 2 on my profile and linked below. Due to size limits, Ive had to splice this into 2 parts unfortunately.
PART 2 deals with General Corporates, Consumer sectors and the Banks.
Link will be added below when its set & posted
PART 2 deals with General Corporates, Consumer sectors and the Banks.
Link will be added below when its set & posted
Part 2 of this thread can be access here:
https://twitter.com/andycwest/status/1582607970655178752?s=20&t=ox-D7y-jkoRhaVzQ9sl9-Q
• • •
Missing some Tweet in this thread? You can try to
force a refresh