To make exchange holdings easier to understand, below are both their relevant portfolios & associated explanatory statements.
- Binance
- Cryptocom
- OKX
- KuCoin
- Deribit
- Bitfinex
- Huobi
🧵👇
- Binance
- Cryptocom
- OKX
- KuCoin
- Deribit
- Bitfinex
- Huobi
🧵👇
2/ 📌 Assets/Net Worth shown is the value of the holdings in the wallet addresses provided by the exchanges, on blockchains that we support.
It is not meant to be an exhaustive or complete statement of the actual assets/reserves held by the exchange on behalf of its users.
It is not meant to be an exhaustive or complete statement of the actual assets/reserves held by the exchange on behalf of its users.
3/ @binance portfolio: nsn.ai/Binance-Portfo…
Current holdings: $64.3B (removed Binance Bridge pegged tokens, only include their original assets)
Chains:
#Bitcoin
#Ethereum
#Tron
#BNBChain
Binance statement:
binance.com/en/blog/commun…
Current holdings: $64.3B (removed Binance Bridge pegged tokens, only include their original assets)
Chains:
#Bitcoin
#Ethereum
#Tron
#BNBChain
Binance statement:
binance.com/en/blog/commun…

4/ @cryptocom portfolio: nsn.ai/Cryptocom-Port…
Current holdings: $2.36B
Chains:
#Bitcoin
#Ethereum
#Fantom
#Optimism
#Polygon
#BNBChain
#Avalanche
Cryptocom's statement:
crypto.com/company-news/t…
Current holdings: $2.36B
Chains:
#Bitcoin
#Ethereum
#Fantom
#Optimism
#Polygon
#BNBChain
#Avalanche
Cryptocom's statement:
crypto.com/company-news/t…

5/ @okx portfolio: nsn.ai/OKX-Portfolio
Current holdings: $5.84B
Chains:
#Bitcoin
#Ethereum
#Polygon
#Arbitrum
#TRON
#Avalanche
OKX's statement:

Current holdings: $5.84B
Chains:
#Bitcoin
#Ethereum
#Polygon
#Arbitrum
#TRON
#Avalanche
OKX's statement:
https://twitter.com/okx/status/1591370896169930754?s=20&t=wHcVBOvK3V4DKoC24mgJgA

6/ @kucoincom portfolio: nsn.ai/KuCoin-Portfol…
Current holdings: $2.65B
Chains:
#Bitcoin
#Ethereum
#TRON
#BNB
#Polygon
#Arbitrum
#Optimism
#Avalanche
KuCoin's statement:
kucoin.com/blog/transpare…
Current holdings: $2.65B
Chains:
#Bitcoin
#Ethereum
#TRON
#BNB
#Polygon
#Arbitrum
#Optimism
#Avalanche
KuCoin's statement:
kucoin.com/blog/transpare…

7/ @DeribitExchange portfolio: nsn.ai/Deribit-Portfo…
Current holdings: $1.46B
Chains:
#Bitcoin
#Ethereum
#Solana
Deribit's statement:
Current holdings: $1.46B
Chains:
#Bitcoin
#Ethereum
#Solana
Deribit's statement:
https://twitter.com/DeribitExchange/status/1591473425280811014?s=20&t=wHcVBOvK3V4DKoC24mgJgA

8/ @bitfinex portfolio: nsn.ai/Bitfinex-Portf…
Current holdings: $8.23B
Chains:
#bitcoin
#Ethereum
#Polygon
#TRON
#Solana
#Acala
#Avalanche
#Cosmos
#Fantom
#NEAR
#Terra
#TerraClassic
Bitfinex's statement:

Current holdings: $8.23B
Chains:
#bitcoin
#Ethereum
#Polygon
#TRON
#Solana
#Acala
#Avalanche
#Cosmos
#Fantom
#NEAR
#Terra
#TerraClassic
Bitfinex's statement:
https://twitter.com/bitfinex/status/1591370278680293378?s=20&t=DKZ1H_pawsvLMhs_baCfLA

9/ @HuobiGlobal portfolio: nsn.ai/Huobi-Portfolio
Current holdings: $3.31B
Chains:
#Bitcoin
#Ethereum
#Polygon
#TRON
#Solana
#Avalanche
#Cosmos
Huobi's statement: huobi.com/support/en-us/…
Current holdings: $3.31B
Chains:
#Bitcoin
#Ethereum
#Polygon
#TRON
#Solana
#Avalanche
#Cosmos
Huobi's statement: huobi.com/support/en-us/…

10/ @Bybit_Official portfolio: nsn.ai/Bybit-Portfolio
Current holdings: $1.89B
Chains:
#Bitcoin
#Ethereum
#Polygon
#TRON
#Solana
#Arbitrum
#Avalanche
#Fantom
#Ripple
#Aurora
#Moonbeam
#Moonriver
#Optimism
@benbybit' statement:
Current holdings: $1.89B
Chains:
#Bitcoin
#Ethereum
#Polygon
#TRON
#Solana
#Arbitrum
#Avalanche
#Fantom
#Ripple
#Aurora
#Moonbeam
#Moonriver
#Optimism
@benbybit' statement:
https://twitter.com/benbybit/status/1592797790518018048?s=20&t=5lhtCXa8wtnwPSpkUgKY0Q

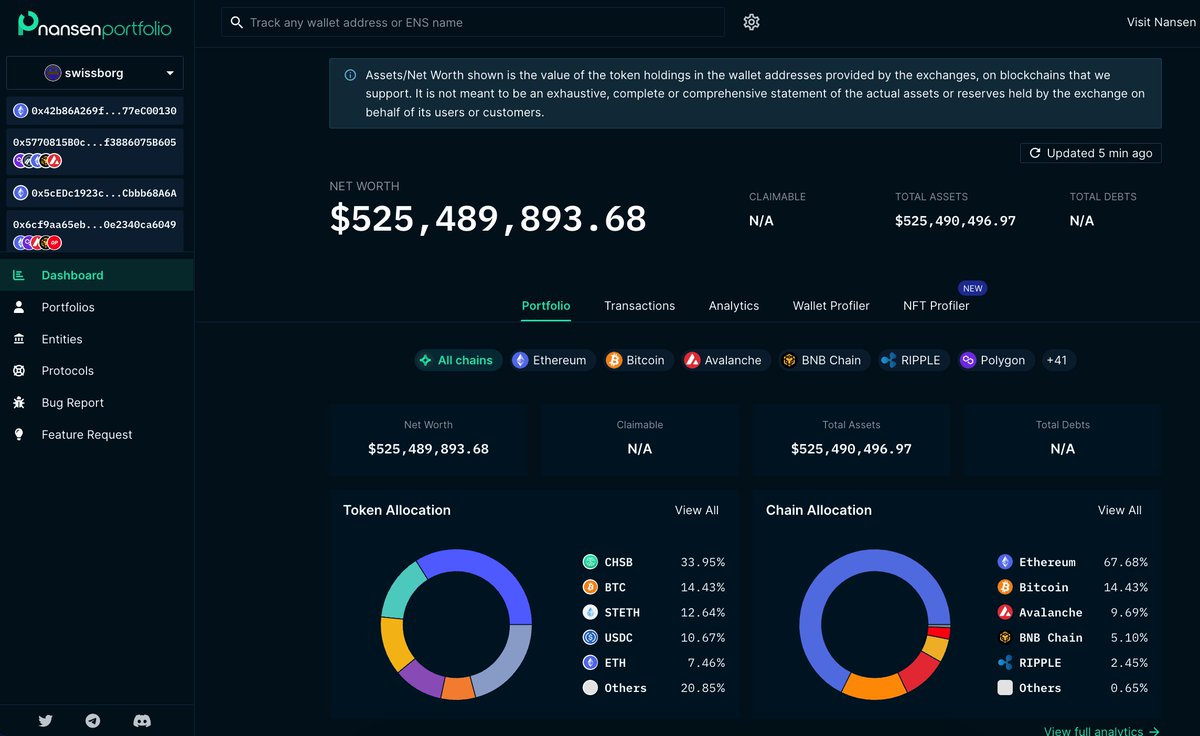
11/ @swissborg portfolio: nsn.ai/SwissBorg-Port…
Current holdings: $525.5M
Chains:
#Bitcoin
#Ethereum
#Polygon
#BNBChain
#Solana
#Arbitrum
#Avalanche
#Cardano
#Ripple
#Near
#Optimism
SwissBorg's statement: swissborg.com/blog/in-swissb…
Current holdings: $525.5M
Chains:
#Bitcoin
#Ethereum
#Polygon
#BNBChain
#Solana
#Arbitrum
#Avalanche
#Cardano
#Ripple
#Near
#Optimism
SwissBorg's statement: swissborg.com/blog/in-swissb…

• • •
Missing some Tweet in this thread? You can try to
force a refresh


